NQ GC ES, Daily Orderflow and Weekly OutlookCME_MINI:NQ1! COMEX:GC1! CME_MINI:ES1!
Time for the final AMDX
ISP1! trade ideas

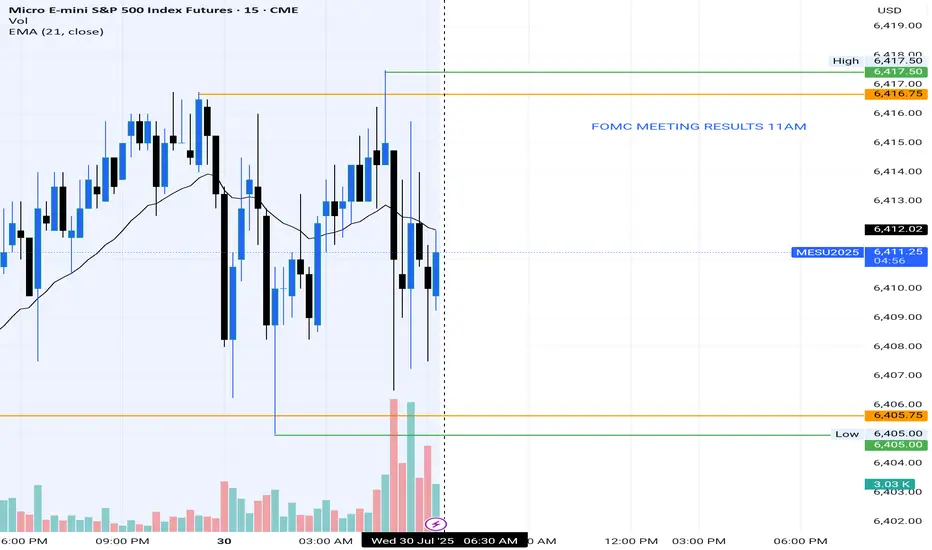
Choppy all day till 11AM PTLooks like it'll be one of those days until 11 :(
What are your thoughts?
Call trade nasdaq? Curious to know how other sectors are. I only track Mes
Day 7 Trading Only S&P Futures — Trusting Structure Over GreedWelcome to Day 7 of Trading Only S&P Futures!
Today was a mixed day with a small loss of -$16.65. I started strong, up $133 early on, but after a big push up, I expected the market structure to flip bearish and missed a key long entry. Later, I shorted the 6451 resistance but let greed get the best of me, holding too long and turning a winner into a loss.
The key lesson? Trust the market structure and the double down (DD) signals — don’t fight the system.
📈 What you’ll learn
Why trusting structure and signals beats guessing the market
How greed can sabotage even well-planned trades
The importance of taking profits on key moves
Reading VX Algo signals for better trade timing
⏰ Timestamps
0:00 — Intro & Day 7 Recap
0:30 — Trading Wins & Mistakes
1:30 — VX Algo Signal Review
2:30 — Market News & Impact
3:30 — Key Levels for Tomorrow
🔔 VX Algo Signals (9:30am – 2pm EST)
8:29 AM Market Structure flipped bullish on VX Algo X3!
10:10 AM VXAlgo NQ X1 Buy Signal
10:20 AM VXAlgo NQ X1DD Buy Signal (double buy)
11:30 AM VXAlgo ES X1 Sell Signal
11:50 AM VXAlgo ES X1 Sell Signal
12:10 PM VXAlgo NQ X1 Sell Signal (double sell)
12:40 PM VXAlgo NQ X1 Sell Signal
📰 News Highlights
S&P 500 closes at a new record high.
🔑 Key Levels for Tomorrow
Above 6410 = Remain Bullish
Below 6390 = Bearish

SP500 LongSP500 is not net long the regression break.
I am considering a limited risk position long.

Solid closeBuyers created a solid close on the daily S&P 500 chart. The expectation for Wednesday is follow through with an objective to the upside of 6495.

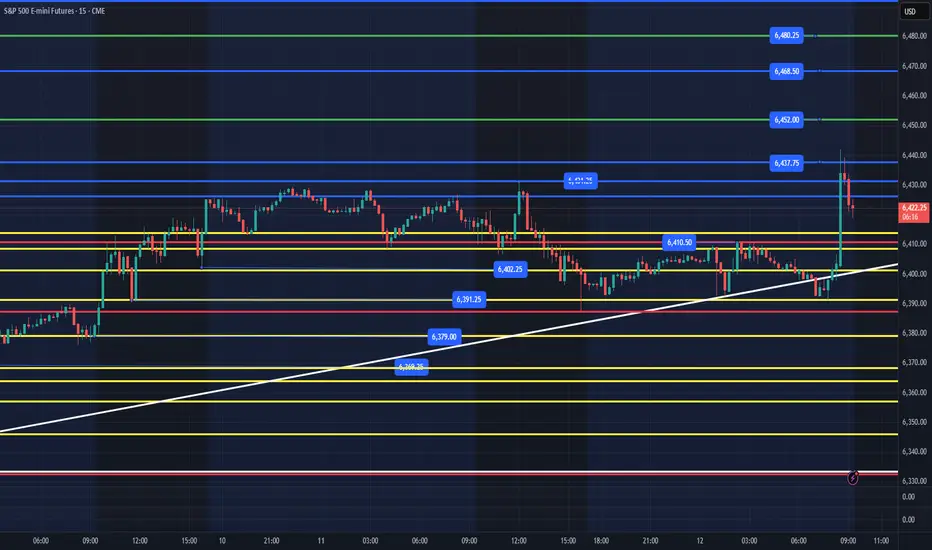
ES - August 13th - Opening Session Trade PlanToday's CPI was not as complex as I have seen in other releases. While price tried to shake out longs by ripping 40pts at the 8:30am CPI release, sold off and held structure support at 6410 and continued higher and have met 2 out of 3 targets I had planned for the week.
I posted the following this morning.
"IF, price can hold the 6411-14 area, we should be able to put in a nice bull flag and continue up after the 9:30am NYSE open. IF, price losses the 6410 level, we might need to try and dip below yesterdays low at 6387 and then rally up. We are still targeting the levels above at 6452, 6468, 6480 to hit this week."
We hit 6409.75 and took off and hit our 6452 & 6468 targets!
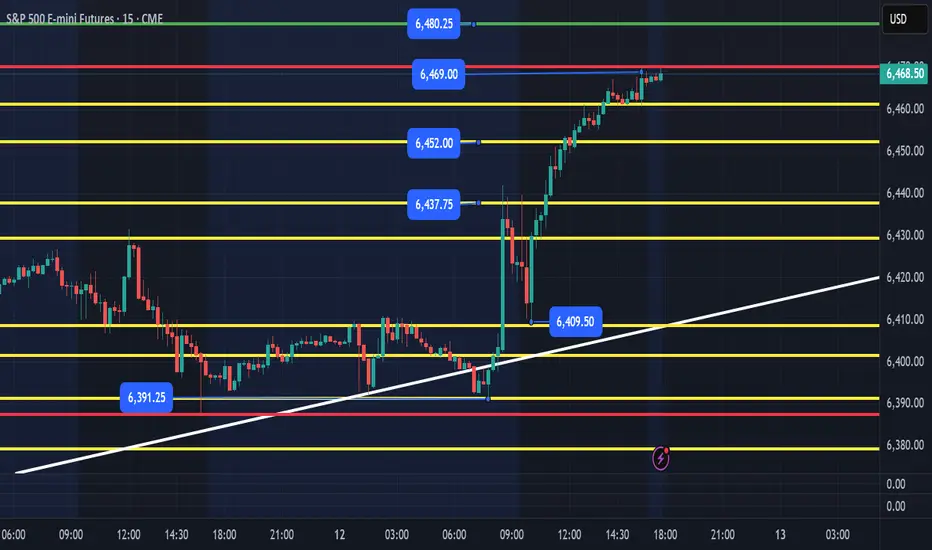
What is next for ES with PPI coming out tomorrow and OPEX on Friday. I expect to see more complex trading the next couple of days. ES closed at the highs and are only 12pts from our last target of 6480 this week. ES can continue higher with price putting in structure between 6430-6468. The yellow support levels I have outlined are areas we could see price test, recover, reclaim and move us higher. Ideally, we can set a low overnight that we flush and recover to get us to the 6480, 6493+ targets.
IF, price needs to cool off, we would want to see it go no lower than 6430 area with a reclaim of the 6437 support level. That would be a healthy pullback and keep structure moving higher.
There is nothing short term bearish until we lose the 6391 level. IF, price does go that low, we should see an initial bounce, but would be a warning sign. The RSI on the 8hr chart is currently at 80, which alone isn't a signal that price will reverse, it is something to keep an eye on. We could get a rug pull tomorrow after the PPI release all the way back down to the 6390 level, IF, we do and ES is selling fast, wait for price to build structure around 6380-85 level and enter once it clears the 6390-92 level.
I will post an update and Daily Trade plan by 8am EST based on overnight price action.
You can reference my trade plan from today by looking at the related publication section to the right and also see my weekly overview I posted on Monday am. Follow to get my daily trade plan.
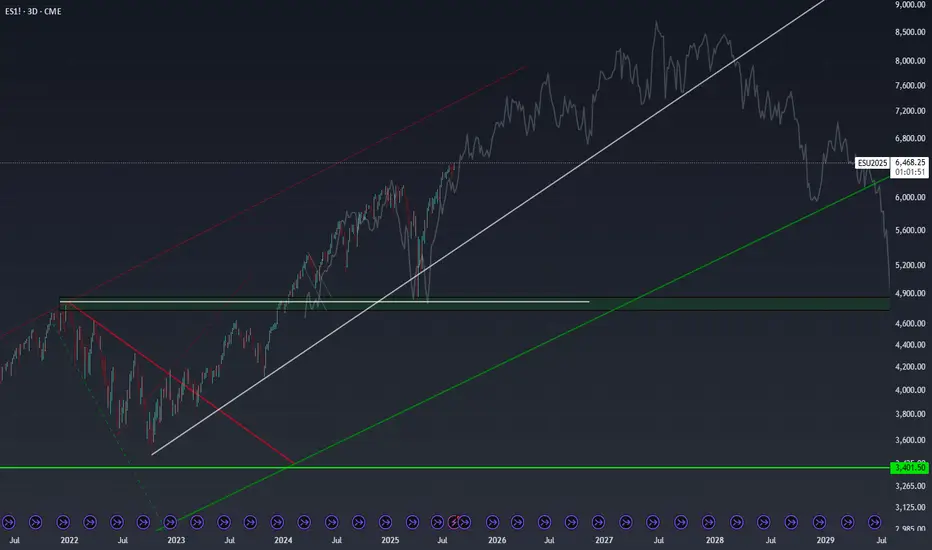
Are We Replaying the Dot Com Era?I’m completely unbiased here - more so curious - but today’s S&P 500 setup looks eerily similar to the late 1990s. In 1996 and 1997, the index posted back-to-back gains of over 20%, just as 2023 and 2024 have done. Then, in 1998, we saw a sharp 20% pullback - much like the one we’ve had in April of 2025. If you overlay that late-’90s fractal on today’s chart, the trajectory points to an S&P 500 level near 8,200 by early 2027.
The bullish case practically writes itself: strong GDP growth, resilient corporate earnings, AI-driven productivity gains, a still-accommodative liquidity backdrop, and investors willing to pay up for growth narratives—just as they did in the dot-com era. The “there is no alternative” (TINA) mentality toward equities was alive then, and it’s alive now. If the trend holds, the next couple of years could deliver staggering upside.
That said, it’s purely an observation - not a prediction. A decisive break below the key rising support trendlines would negate this bullish scenario and shift me to a cautious or neutral stance. Until then, the pattern is worth keeping an eye on.
ES - August 12th - Daily Trade Plan9:15am - Daily Trade Plan
I wrote last night that " CPI is tomorrow at 8:30am and my lean is that we hold today's low overnight and continue to move sideways between 6387-6414. Ideally, we can flush down below 6380 and reclaim today's lows of 6387. The levels in yellow and a reclaim of the white trendline are the levels I am watching to trap shorts and move us up higher and out of the range."
Price set an overnight low of 6392 and we touched that level 3X overnight and into this am. You can see that price engaged the trendline areas, flushed below and then rallied. At 7:45am we started to build momentum and when CPI came out we rallied to 6440 area and are currently back testing the breakout zone. IF, price can hold the 6411-14 area, we should be able to put in a nice bull flag and continue up after the 9:30am NYSE open.
IF, price losses the 6410 level, we might need to try and dip below yesterdays low at 6387 and then rally up.
We are still targeting the levels above at 6452, 6468, 6480 to hit this week.
Follow me to be notified of my daily trade plan.
50 50The market structure in the S&P 500 daily chart implies a 50-50 type set up as the market waits for the CPI numbers that will be released on Tuesday.

Stock Index: S&P 500, Nasdaq & Dow Jones Weekly AnalysisBias For This Week:
ES: Bullish Up To $6,468.50
NQ: Bullish Up To $23,845
YM: Neutral

Buyers went into the weekend longThe close on Friday implies that buyers went into the weekend long which is a sign of confidence. The next objective is a close above 6456 on Monday.

Day 5 — Trading Only S&P Futures — +$169, Managing the GrindWelcome to Day 5 of Trading Only S&P Futures!
Today I made +$169 trading ES futures. I was busy so mostly set bracket orders at major levels and let them do their work. The market was a nonstop grind upward, making trading a bit slow.
In hindsight, there was an A+ setup with a triple buy signal and market structure alignment that I wish I had sized heavier on to finish earlier.
📈 What you’ll learn
Using bracket orders to trade during busy days
Recognizing A+ setups with triple buy signals
Managing slow grinding markets with discipline
Key support and resistance levels to watch
⏰ Timestamps
0:00 — Intro & Day 5 Overview
0:30 — Trade Thoughts & Bracket Order Strategy
1:30 — VX Algo Signal Recap
2:30 — Market News Impact
3:00+ — Key Levels for Tomorrow
🔔 VX Algo Signals (9:30am – 2pm EST)
9:35 AM Market Structure flipped bullish on VX Algo X3!
10:50 AM VXAlgo NQ X1 Sell Signal
11:50 AM VXAlgo NQ X1 Buy Signal (triple buy)
📰 News Highlights
S&P 500 rises to end the week, Nasdaq hits a new record as Apple shares rally.
🔑 Key Levels for Tomorrow
Above 6367 = Remain Bullish
Below 6334 = Bearish

ES : Short levelThe level has been activated, so you can short it. I have slightly edited it since last time. It is best to scalp or pips it; I cannot promise any significant movement. Be careful when trading on news or at market close/open.

Review S&P 500 futures weekly chart - 8/8/2025Price is Knocking on the Door of All-Time Highs
The bulls are back in control. Price is pushing above the 6,400 magenta resistance, a level that has capped rallies before — and we’re now testing it head-on. The uptrend from the late-2022 low remains strong, with price riding comfortably above the green moving average ribbon like a surfer on a perfect wave.
The last big pullback in early 2024? It was a clean bounce off the 4,000–4,100 blue support zone, marked by a textbook "Bull Wick" reversal candle. That move lit the fuse for a powerful rally, and the setup now has a similar feel.
Key Levels I’m Watching
Resistance: 6,400 (magenta) – in play right now.
Support: 5,600 (red), 4,300 (blue), and a deeper 3,800 zone (blue).
History shows that breakouts above major resistance here have triggered multi-week runs.
The Indicator Story
MACD: Bullish crossover forming, histogram shifting into positive territory → momentum is building.
Stochastic RSI: Tapped overbought and curling slightly down → short-term cooling possible.
RSI: Near 70, still in bullish territory and not yet screaming overbought.
The Bigger Picture
On the weekly chart, the trend is undeniably strong. Price is above all major moving averages, and momentum is on the bulls' side.
However, with multiple oscillators sitting high, the market might need to catch its breath — either through a small pullback or sideways consolidation — before launching into the next leg higher.
Bottom Line
The breakout is here, but confirmation is key. A strong push and close above 6,400 could open the door to another sustained rally. If the breakout fails, I’ll be watching the 5,600–5,400 range for signs of buyer defense.

OTEUM EXPERT CALL: SP500 – Jackson Hole Fade OTEUM EXPERT CALL: SP500 – Jackson Hole Fade 🏔️🐻
We’re looking for a SHORT(s) in spot and options for a macro swing down into Jackson Hole and the immediate aftermath 📉. Plan is to sell rallies into value (red box), ride the drift lower, and bank along staged targets. After that, we’ll be hunting the first-cut squeeze back up 🏦✂️🚀.
Risk: a surprise dovish leak / policy jawbone that front-runs the cut and squeezes shorts. Size smart, trail tight, don’t overstay.
#SP500 #ES #Macro #JacksonHole #ShortSetup #OTEUM

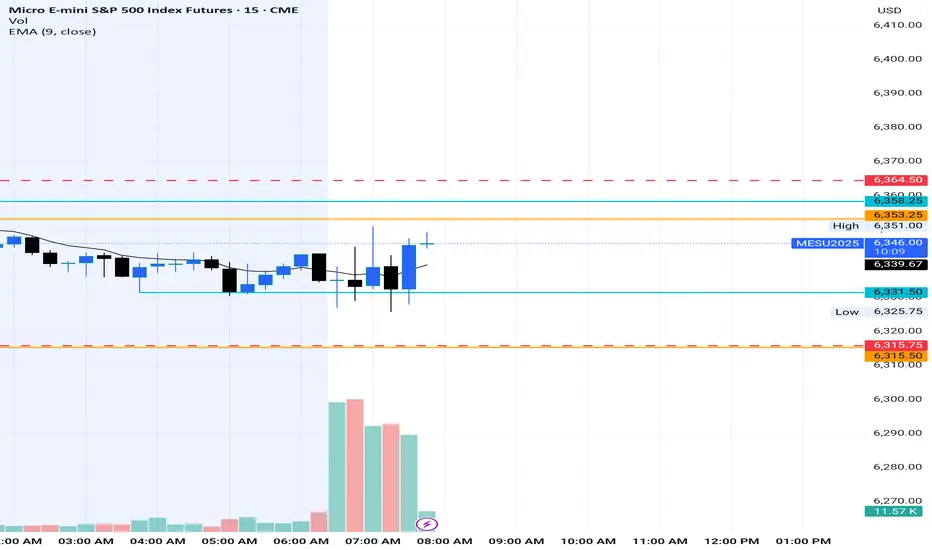
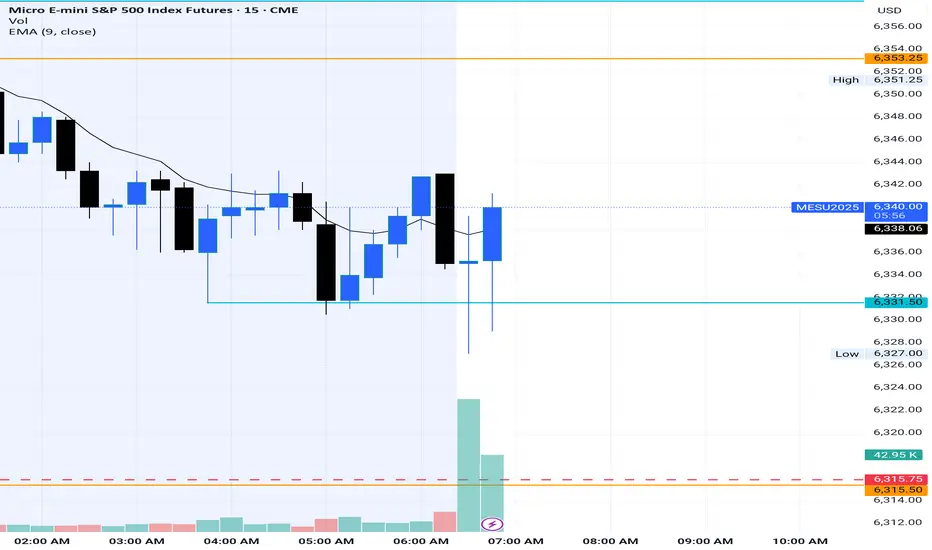
ES - August 7th Evening Open & August 8th - Daily Trading PlanAugust 7th - 4:10pm - Opening Session - Trade Plan
We had a nice move higher in last night's overnight session and then we sold off at the 6400 level by 10am this morning. While price has found a nice short-term bottom at a key level of support 6333, we also rallied in the last hour to clear the 6368 level that was also the overnight low before we broke below it during the daily session. (I had this detailed in my notes that you can review from my last post and is in the related publications section).
We have pretty clear support & resistance levels we are going to be watching overnight and into the morning session.
Price needs to hold 6365 with 6355 at lowest or we will most likely go back down and retest the 6344 & 6333 levels which have been a magnet this week. IF, price can hold these levels, we should back test the 6378, 6391 and potentially the 6400 level that we sold off from.
We are still in a bullish uptrend and can continue all the way to retest the 6426 level if bulls want to. We have nothing short term to be bearish about until 6315 is tested and failure of this level could produce a larger sell off targeting 6297, 6286, 6250, 6240. IF, price does lose 6315 I will be looking for a reaction at the 6286 & 6252 levels for some points to go back and retest the 6315 area.
I will provide an update before 7am EST tomorrow based on the overnight session price action. Make sure to follow so you get notified when I post my daily trade plan.

ES - August 7th - Daily Trade PlanI posted last night (See related publication link) that "our first support down at 6363 level and an ultra-bull case for tomorrow is to build a flag and break out above 6380 with targets of 6386, 6402+". We exceeded the 6402 overnight high and reached 6427. Since we rallied overnight, one headline could take us all the way back down to 6380 or 6363 which is the overnight low. Last night price built a nice bull flag and consolidated between 6380 - 6390. Ideally, we see price come and back test this area maybe gets to around 6386-88, then reclaim 6390 and then go back up and retest the levels ahead. IF, we don't get a reclaim at this level, retesting the overnight lows and reclaim of 6363 would be a great spot for a level-to-level move.
I never like to chase price and when we get a 60pt overnight move, I will be waiting to see how price moves in the first 30 mins of the NYSE Open. I will add an update around 9:45am. Any dip below the levels in yellow and reclaim of these levels, should give us a move back up the levels.

Day 3 — Trading Only S&P 500 FuturesDay 3 — Trading Only S&P Futures
Daily P/L: -142.87
Sleep: 7 hours
Emotions: Headache & stress from the morning
:thought_balloon: Today’s Trade thoughts:
I made a typo when i was putting some orders in from last night that triggered and started the day -300 so I spent most of today just grinding it back again.
I think going forward, I am going to make a rule to limit myself of only doing 2 MES MAX during night time if i plan to put orders in because it really sadden the mood when you start the day negative.
Overall, today's trading day wasn't that bad, we had bullish structure and AAPL event that carried the market up. I took some shorts at 6355 that didn't work out but eventually made money at the end of the day as i shorted 6375 zones. I have noticed that** max Gamma levels don't truly settle until 11am. **
:bell:News Highlights:
*TRUMP TO IMPOSE ADDITIONAL 25% TARIFF ON GOODS FROM INDIA
:bar_chart: VX Algo Signals (9:30am – 2pm EST):
9:30 AM Market Structure flipped bullish on VX Algo X3! @everyone*
10:20 AM VXAlgo NQ X1 Sell Signal
11:00 AM Market Structure flipped bullish on VX Algo X3!
11:40 AM VXAlgo ES X1 Sell Signal
12:20 PM VXAlgo ES X1 Sell Signal (double sell)
1:40 PM VXAlgo NQ X1DD Buy Signal (double buy)
:chart_with_upwards_trend: Key Levels for Tomorrow:
Above 6332 = Remain Bullish
Below 6315 = Bearish

Buyers have shown upBuyers have shown up in the S&P 500 daily chart. The challenge will be followed through. The next objective to the upside is 6393.

Nq & Es Analysis 06-08-2025 After the OpenAs expected, the first scenario played out — with the Nasdaq pushing higher, pulling back for a retracement, and then targeting the previous day’s high. The only difference was that the S&P 500 initially printed some lows and showed more sluggish behavior compared to the Nasdaq. However, once the market opened and volatility kicked in, price resumed its true direction.
Challenging day overall, with some unusual price action. Still, as you can see, the key levels we shared earlier held up beautifully once again.
See you tomorrow — 30 minutes before the market opens (09:00 AM) NY TIME!

Sideways actionLots of cool between zones more apparent in the 5 minute time frame. No significant news. What are yalls thoughts? I was originally short but my ideal entry keeps teasing me and I took a dumb long. Should have been more patient on my end.
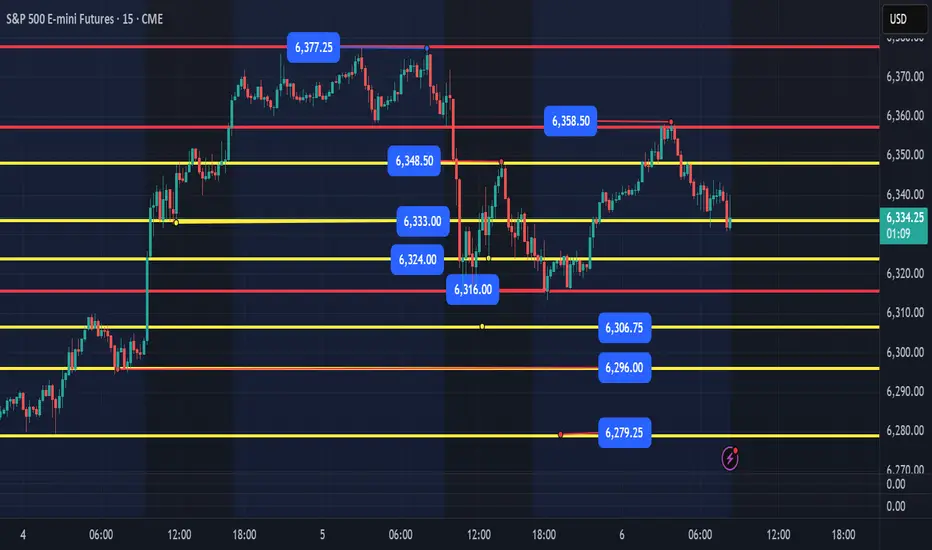
ES- August 6th, 2025 - Daily Trading Plan6315 was yesterday's low and our overnight low. It has been tested multiple times and while typically it would be a great place for a flush and reclaim, it has also been tested and is very weak. IF, price breaks below 6315, we might get a quick pop, but I would rather see us flush down to 6296 or 6280 area and then reclaim 6296 for a level-to-level move and back test the 6315 level. IF, price clears 6315 we can continue to retest the 6333 & 6358 levels. We continue to trade in small ranges and until we can clear 6377 or flush Friday's level of 6240 and recover, it will be tough to find good quality setups. We really need to flush the 6240 level for a nice move back up to retest 6315.
I will update my session plan after 9:30am open.