Neutral zone trade formingThe daily structure in the S&P 500 implies this set up for a neutral zone market environment which means a sideways move. The market is waiting for information to create a directional move.
ISP1! trade ideas

Day 2 — Trading Only S&P Futures — -$100, Grinding Back from Los Day 2 — Trading Only S&P Futures
Daily P/L: -100
Sleep: 8 hours
Emotions: Good
:thought_balloon: Today’s Trade thoughts:
I rushed into a trade thinking 6330 was going to be a good area of support to buy and oversized my position going 5 mes deep in my first trade and adding 5 more at the 48 min MOB at 6325 and got stopped out at the bottom down -400 and pretty much spent the rest of the day grinding back up.
Overall market seem to have rejected the higher timeframe resistance and deciding which direction to go.
:bell:News Highlights:
U.S. STOCKS END LOWER, VIX JUMPS AFTER WEAK ISM SERVICES DATA
:bar_chart: VX Algo Signals (9:30am – 2pm EST):
— 9:30 AM VXAlgo ES X1 Buy signal
— 9:40 AM VXAlgo NQ X1 Buy Signal
— 9:48 AM Market Structure flipped bullish on VX Algo X3!
— 11:00 AM VXAlgo ES X1 Buy signal (triple buy signal)
— 12:50 PM VXAlgo NQ X1DD Sell Signal
— 1:00 PM Market Structure flipped bullish on VX Algo X3!
— 1:30 PM VXAlgo NQ X1DD Buy Signal**
:chart_with_upwards_trend: Key Levels for Tomorrow:
Above 6332 = Bullish
Below 6310 = Bearish

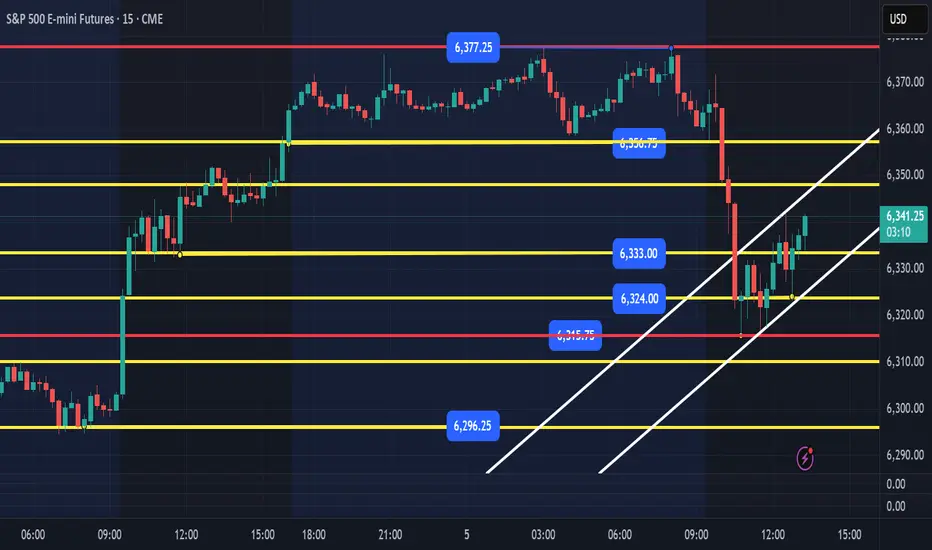
ES - August 5th/6th Opening Session - PlanI had identified a potential bear flag this afternoon and stated that we needed to lose 6324 to start moving lower with targets of 6306 and 6296. This is still valid, and I anticipate the opening session to start that sell off to these targets. IF, price moves above 6336 before breaking below 6324 then the bear flag will be invalid, and we continue up higher before a pull back.
I plan to update my August 6th Daily Plan by 7am EST. I am hoping we get a nice pull back overnight so we can find some good setups to long for points tomorrow!

ES THOUGHTSES is on the verge of retracing to its monthly 50% correction mark, so my bias is bearish. Price retrace up nicely, looking for shorts to go lower. simple, sweet and short.

ES - August 5th - Afternoon Update1:25pm EST - Afternoon Update.
Price looks to be building a bear flag from the am sell off. This would be validated with a loss of 6323 level and you could look to short down to 6310, 6298. I would take my profit at 6310, as you could get a short squeeze right below or at the 6298 level. As a long ES trader, shorting for 10pts is not my edge. IF, you like to short that would be what to watch for.
I am still looking for a long at 6298 or 6275-77 flush and reclaim of these levels. We need some volatility and we might get some after 2pm today.
/MES S&P Futures (ChopDay)Good morning guys here we have a 4hr ES Futures chart that I created clearly showing you a Yellow dotted bounding box which shows what I call a No Trade Zone / Institutional Liquidity Grab. In simple terms " Dont Trade / sit on your hands "
It seems that we are consolidating and awaiting for market direction either Up or Down, my educated guess is that we may have a little pump but higher probability to the downside based on my studies. You will see wicks above and below the bodies of the 4hr candles, that to me tells a story, what is the story? A day where the market will chop around most likely and take your money it is Bulls too scared to move higher and Bears scared to pull the trigger to the downside thinking they will get trapped but in my eyes the market is overbought and exhausted, it needs a break. Does it mean that it will drop, absolutely NOT, the market can in fact continue to push higher if it wants but in my opinion, it seems that down should be the way at least for the next few weeks or months.

Follow through to the upside is expectedFollow through to the upside in the S&P 500 daily chart is expected for Tuesday after the dramatic return of buyers on Monday.


ES - Daily Session Trade Plan - Update August 4th, 2025 8am EST update -
Overnight price found a low at 6252 reached 6310 as the high. 6296, 6277, 6252 are the 3 main supports below. A flush and level reclaim of any of these supports should see price continue higher with targets of 6325, 6350, 6375.
IF price loses 6252 or Fridays low at 6240, these would be the higher quality levels we would want price to flush and reclaim for a move higher.
6297 support holds and we break the overnight high at 6310, the back test of this breakout would be worth a level to level move up to 6325.
The main levels I am watching is 6252 or 6240 to be tested, flushed and reclaimed. It would be best to wait for the 9:30am open and see how price reacts. I could see price flush in the first 30 mins, then catch bears offside and reclaim the Fridays lows. That would be a great short squeeze area to ride a couple of levels of back testing the overnight price.
Below Fridays lows and I will be waiting for price to build structure at the supports of 6225, 6210, 6194, 6175. If ES is selling hard into these areas, I would wait to enter any longs until I see structure build and reclaim the levels I have outlined. Let price come to you and be patient.
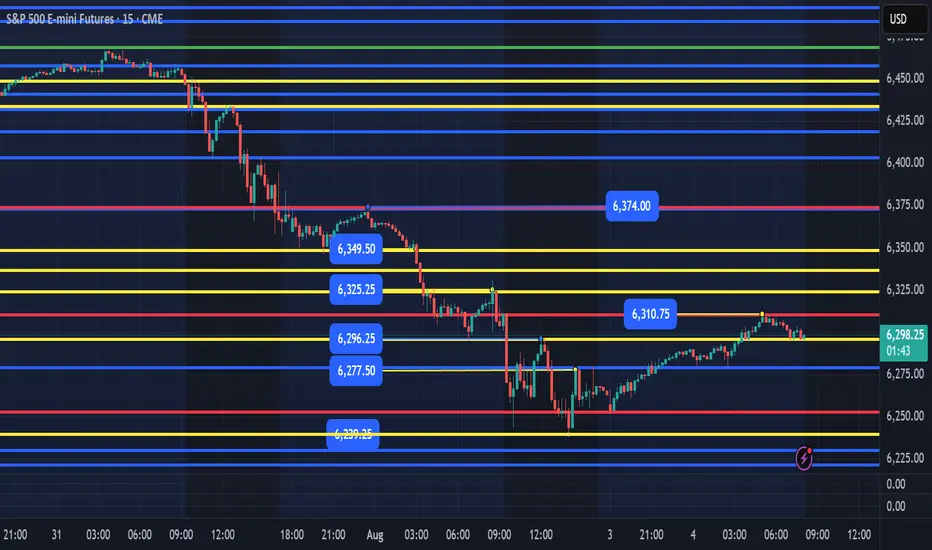
ES - August 4th, 2025 - Daily Trade PlanI am providing my plan for the session and will update before 8am EST with overnight session price movement and what I am looking to do during the 9:30am EST session. All levels below are labeled or colored.
6:07pm EST - Opening Session Overview for August 4th, 2025 - Daily Trade Plan
We could very well dip to 6230-40 range and then move back up the range to retest the 6375 level. The key levels I will be looking to reclaim and take some points from are as follows:
Resistances – 6297, 6315, 6330, 6350, 6370
Supports – 6240, 6225, 6190.
Ideally, we lose Fridays low of 6239 and reclaim it for a level-to-level move. If not, we need to continue to build structure between 6296 and 6240. 6275 was rejected 2x on Friday late and if we clear 6275, a back test of this would be a good place to grab points to 6296 and then possibly continue to 6315, 6330, 6350, 6370.
I will not be shorting or engaging in any level below 6240, unless structure builds at the 6225, 6190 lowest it would want to go.
Update will be provided by 8am EST for 9:30am EST Session open.

ES : Key levels⚠️ VOLATILITY WARNING ⚠️
Trading around major news can be extremely unpredictable. Trade responsibly!
Here are the key levels that the market will be interested in. So far, the green level of ~6.263 is likely to bounce, but it is old. I'd wait for something fresher.
From the minor timerframe, we can soon go long from ~6.352. If I'm at my computer and everything works out at this level as it should, I'll let you know.
**07/31/25 Trade Journal, and ES_F Stock Market analysis **
EOD accountability report: +
Sleep: 5.5 hours
Overall health: Good
** VX Algo System Signals from (9:30am to 2pm) **
— 9:00 AM Market Structure flipped bullish on VX Algo X3
— 9:30 AM VXAlgo ES X7 Sell signal
— 9:32 AM Bullish market structure got cancelled
— 11:40 AM VXAlgo NQ X1 Buy Signal
— 12:40 PM VXAlgo NQ X1 Sell Signal
— 1:00 PM Market Structure flipped bullish on VX Algo X3!
— 1:22 PM if we lose 6415 and stayy under it . Bullish Market structure is cancelled.
— 1:55 PM VXAlgo NQ X1 Buy Signal
What’s are some news or takeaway from today? and What major news or event impacted the market today?
Today marked the 4th day of the structure signals being iffy as they try to tip the volumes bullish just to cancel it right afterwards.
I was starting to get a bit tilted today as I had a bunch of orders at area that didn't get filled and eventually just gave up trying to have a green day and walked away.
looking at some of the other charts, i also we are getting a doji on the longer time frames and it is starting to look like bear's wet dream.
However, Mag 7 stock earnings were really great, the only downside was rate cut isn't happening.
News
*U.S. STOCKS END LOWER, VIX JUMPS AS S&P 500, NASDAQ RETREAT FROM RECORDS DESPITE MONSTER META AND MICROSOFT EARNINGS
What are the critical support levels to watch?
--> Above 6415= Bullish, Under 6403= Bearish

Potentially more volatilityThe daily chart in the S&P 500 implies the possibility of additional volatility as more fundamental news is revealed on Thursday and Friday. The bias currently is for continuation to the upside.

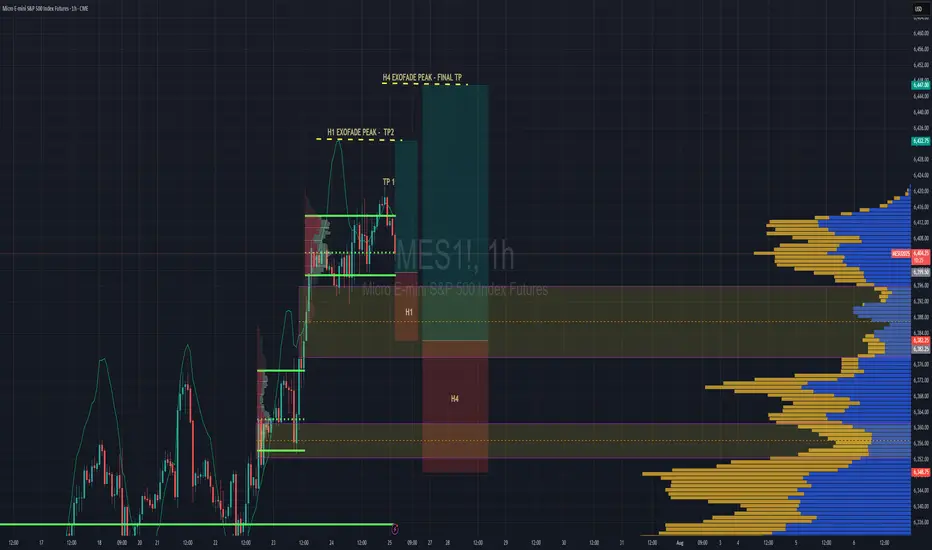
S&P 500 Intraday & Swing Entries H1 entry is close to getting activated for intraday.
If you want a swing trade then wait for H4 entry (you might be waiting a while obviously)
Reason for entries - We have broken out of Balance since July 25th and currently in a trend phase until we establish a new value area, or return to the one we broke out from.
So since Trend and Momentum is UP, then we should find Low Volume Areas to enter in the direction of the trend for a classic pullback entry trade.
07/30/25 Trade Journal, and ES_F Stock Market analysis EOD accountability report: +960
Sleep: 5 hours
Overall health: still struggling with sleep due to heat waves
VX Algo System Signals from (9:30am to 2pm)
— 8:30 AM Market Structure flipped bearish on VX Algo X3!✅
— 9:45 AM Market Structure flipped bullish on VX Algo X3! ✅
— 10:30 AM Market Structure flipped bullish on VX Algo X3!❌
— 11:30 AM Market Structure flipped bearish on VX Algo X3!❌
— 12:00 PM VXAlgo NQ X1DD Buy Signal, ✅
— 12:30 PM Market Structure flipped bullish on VX Algo X3!✅
What’s are some news or takeaway from today? and What major news or event impacted the market today?
I have started to noticed that the last 3 days, we have been getting false triggers on market structure signals and it almost feels MM are trying to do it to break people's algo that trade on that.
This is a good reminder that no matter how successful the signal has been for the last 30 days, you still need to have risk management. additionally, it's also a good way to test people's faith and trick new traders in going back to doing random things because it makes them think market can behave randomly and nothing works.
this is why i always tell people to religiously test out a system for 30 days before giving up.
News
*FEDERAL RESERVE SKIPS RATE CUT, KEEPS FED FUNDS RATE AT 4.50%
What are the critical support levels to watch?
--> Above 6410= Bullish, Under 6400= Bearish

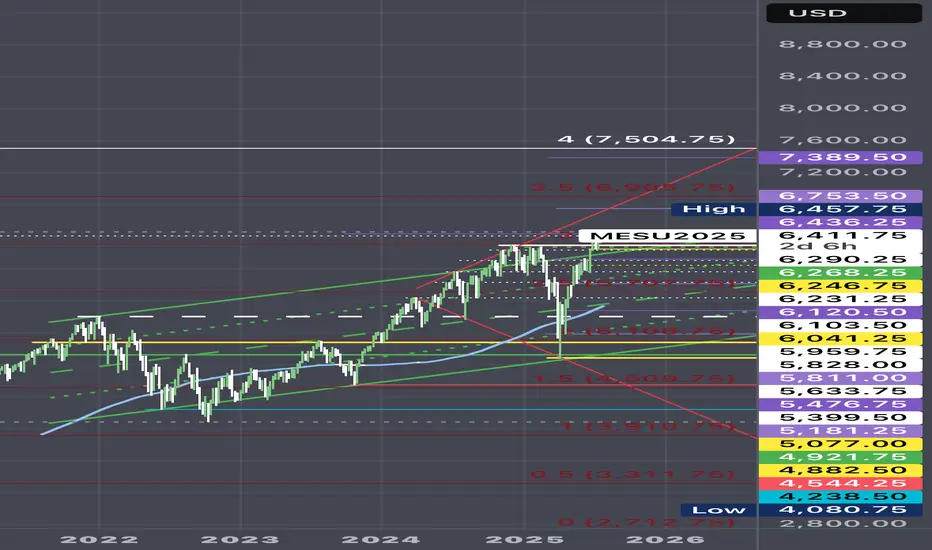
/ES held its main channel!ES held its main channel in the early 2025 dip. Now currently inside the red megaphone with a breakout target of 7500.
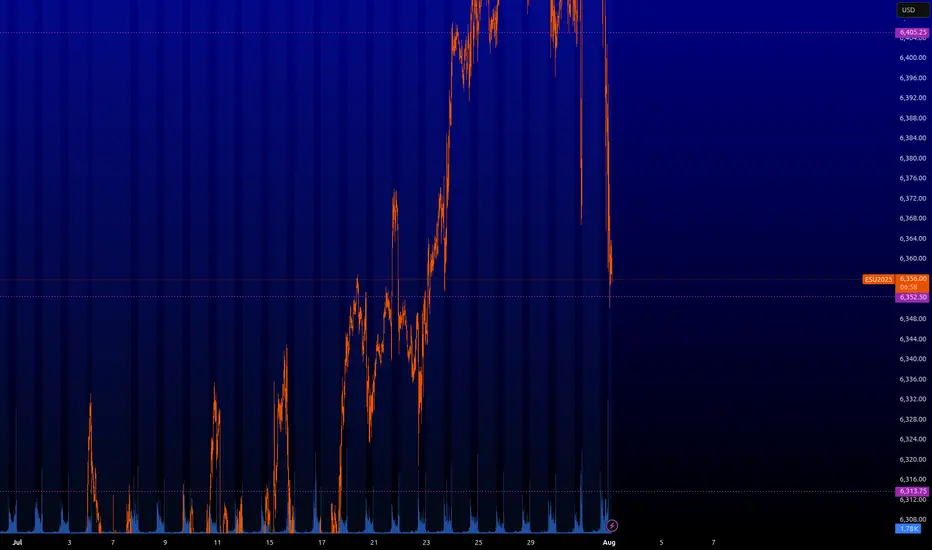
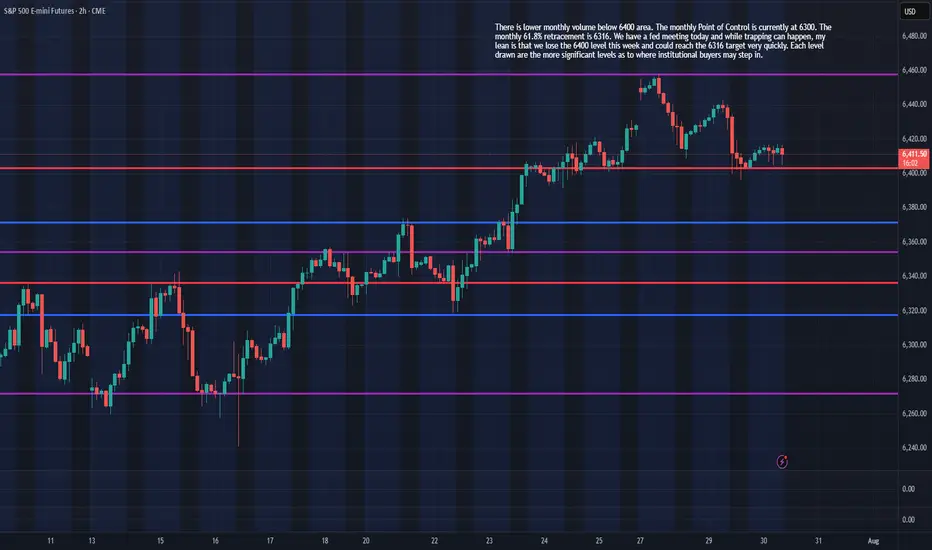
Tech Earnings & Fed Meeting - July 30th - ES 100pt drop?I trade ES Futures and have identified an important support shelf that if broken could accelerate lower.
There is lower monthly volume below 6400 area. The monthly Point of Control is currently at 6300. The monthly 61.8% retracement is 6316. We have a fed meeting today and while trapping can happen, my lean is that we lose the 6400 level this week and could reach the 6316 target very quickly. Each level drawn are the more significant levels as to where institutional buyers may step in.
Long ES.. Probably a long in play if we cross/close above CISD as marked.. target the internal BSL as our target.. we sweep to ERL .. If you think i have drawn these incorrectly, i am happy to learn. Thank you

Potential transitionThe S&P 500 daily chart has gotten down to levels that buyers have entered this market previously. This means be cautious on the short side and be aware of the fundamentals that will be released on Wednesday.

Stock Index Matrix: ES, NQ, YM Weekly BiasES: $6,323.25
NQ: $23,171.50
YM: $44,504
Bearish for all markets mentioned

07/29/25 Trade Journal, and ES_F Stock Market analysis EOD accountability report: +734
Sleep: 5 hours
Overall health: Been struggling with sleep due to heat waves
VX Algo System Signals from (9:30am to 2pm)
— 8:00 AM Market Structure flipped bearish✅
— 9:30 AM VXAlgo NQ X3 Buy Signal✅
— 9:36 AM Market Structure flipped bullish on VX Algo X3! ❌
— 11:49 AM VXAlgo ES X1 Buy signal✅
— 11:59 AM VXAlgo NQ X1 Buy Signal❌
What’s are some news or takeaway from today? and What major news or event impacted the market today?
Today was one of the few short the resistance day and refreshing to see after we been grinding ATH (all time highs)
News
— 1:30 PM
🇺🇸🇨🇳 *CHINA SAYS IT AGREES WITH US TO EXTEND TARIFF TRUCE
What are the critical support levels to watch?
--> Above 6395= Bullish, Under 6374= Bearish

ES Scenario 2 29-07Finally, scenario 2 was realized today, touching and perfectly respecting the levels that we had previously indicated, rising upwards to the equilibrium point and then continuing downwards. While the Nasdaq was more bullish at the beginning, it also fell quite a bit.

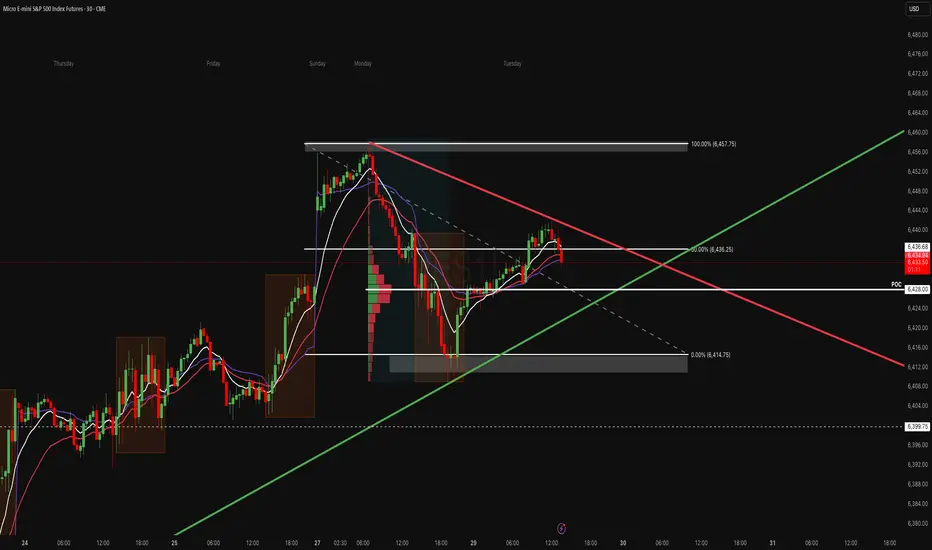
POC Pressure Cooker – MES Prepares for VolatilityWe’re heading into the NY session with MES balancing between key levels. The 50% retracement of the recent range (6436) is acting as a pivot, while the POC at 6428 is the immediate area of interest. The structure is tight here’s both sides of the play:
Key Levels to Watch:
- Upper Range: 6457–6460 (recent swing high)
- Mid-Range Pivot: 6436 (Fib 50%)
- POC & Support Zone: 6428 (volume shelf)
- Lower Range: 6415 → 6400
🟩 Bullish Scenario
A breakout and hold above 6440–6445 could lead to a retest of 6457–6460, with potential continuation to 6470+ if momentum accelerates.
- Confluence: Higher low structure above 6428, EMAs curling up, and price reacting positively to POC.
- Invalidation: Clean break and close below 6428.
🟥 Bearish Scenario
A failure to hold 6430 and a push through 6428 (POC) could see sellers target 6415, then possibly 6400.
- Confluence: Descending red trend line still capping price, and VWAP rejections could support a downside move.
- Invalidation: Break above 6457 with strong buyer aggression.
Staakd Notes:
This is a range-play environment. The real edge is in waiting for a break + retest of 6440 or 6428 to confirm direction. NY open volatility is likely to provide a fake out before the true move. Give it 30 mins from open.
Closing Line:
“Price is coiled between POC and the 50% mark. We’ll let NY open show its hand then react, not predict.”