Will The Bears Viciously Attack Lowe's Again?Lowe's is setting up to repeat previous large declines after its most recent earnings call. The stock has been in a bullish trend since 2015. The stock has cycled in tight channels up and down throughout this bullish run. Currently Lowe's just repeated movement that has resulted in a two quick 13% drops. Near-term downward movement is outlined below.
When we take a look at other technical indicators, the relative strength index (RSI) is at 30.2113. RSI tends to determine trends, overbought and oversold levels as well as likelihood of price swings. I personally use anything above 75 as overbought and anything under 25 as oversold. Currently the RSI is near oversold levels. This indicator does contradict my projected movement, however, both previous similar pattern instances kept the RSI hovering around oversold levels during the course of their drops.
The true strength index (TSI) is currently 1.8606. The TSI determines overbought/oversold levels and/or current trend. I solely use this as an indicator of trend as overbought and oversold levels vary. The TSI is double smoothed in its calculation and is a great indicator of upward and downward movement. The TSI is pointing down. More importantly the 50 day moving average on the TSI has begun to trend down. This exact same thing happened the last two times the stock gave up 13%.
The positive vortex indicator (VI) is at 0.7017 and the negative is at 1.1622. When the positive level is higher than 1 and higher than the negative indicator, the overall price action is moving upward. When the negative level is higher than 1 and higher than the positive indicator, the overall price action is moving downward. Currently the stock is dropping per the trend and position of these indicators.
The stochastic oscillator K value is 23.1291 and D value is 22.7512. This is a cyclical oscillator that is highly accurate and can be used to identify overbought/oversold levels as well as pending reversals and short-term activity. I personally use anything above 80 as overbought and below 20 as oversold. When the K value is higher than the D value, the stock is trending up. When the D value is higher that the K value the stock is trending down. The current signal has the stock flirting with oversold. Similar to the RSI on the last two drops of 13%, the stochastic hovered around oversold territory for a while. This scenario could be repeated this time as well.
During the bull trend, the stock has cycled up and down. When the stock breaks down from its upcycle trend, the stock has dropped 13%. This occurred in early 2016 and again in August of 2016. Both drops occurred within 25 trading days. On May 24, the stock broke down from its recent uptrend. A 13% drop would take the stock down to 69.85. A fairly likely drop could bring the stock down to at least 75.50 in the near-term.
Considering the RSI, TSI, VI and stochastic levels, the overall direction favors a move to the downside. Based on historical movement compared to current levels and the current position, the stock could drop at least 4% over the next 34 trading days if not sooner.
LOWC34 trade ideas


LOW - Upward channel breakdown short if weakness after earningsLOW seems running within a wide upward channel, and at this time coming down from Upper channel line. We have earnings for it tomorrow, so we would like to see how it reacts. However if it shows weakness after earnings, we will consider for a short entry.
* Trade Criteria *
Date First Found- May 23, 2017
Pattern/Why- Upward channel formation with Earnings ahead.
Entry Target Criteria- show weakness after Gapping up to $86.00 or $83.23, or Break of $81.87
Exit Target Criteria- $68.16
Stop Loss Criteria- $87.26
Please check back for Trade updates. (Note: Trade update is little delayed here.)


LOW - Caution Potential TOPMultiple Signals of a potential TOP from my dTFIs on the WEEKLY chart
Caution...


Lowes - testing the top of triangle within 7 test of consol box68 Seemed a fair market price for Lowes - Looking to potentially enter LT long on this dividend payer if we see a 8th test of the consolidation box.
Notice the triangle test along the 7th hit of the consolidation box - strong moves tend to come after years of consolidation and Lowes price could be setting up to make the top of the triangle broadening formation support.


LOW - Potential short trade, looking for Put option playLOW seems forming a head & shoulder formation & shaping up nicely for a short trade.
To trade this we would consider $72.50 / 70 Jun/July Puts.
You can check detailed analysis on LOW in the trading room/ Executive summary link here-
www.screencast.com (Available to subscribers)
Time Span- 43:40"
Trade Status: Pending

LOW- Getting any lower? Maybe not that much. I am not long yet but here's my game plan for Lowe.
I have to humbly admit that I was in Lowe when if popped to $76 with some calls... but I rode the fade until I had a small loss ;-) From a significant gain to a small loss. Hats off to the faders on this one ;-)
I was pretty new at this game and I did lose some easy profits like this in the last few months (nailed some good pops as well.) Fortunately, I now have a game plan for those situations.
I am realizing that huge runs like $TECK and $PLCE are not as common as I would like to see them.
Got to bag those fast easy profits and move on... If I have several contracts / share, let a few run just in case as it does suck when you realize that you could have made 1200% on a call instead of 200-300%. It happened to me with $PLCE last summer.
What do we have here? Lowe is clearly not in the same league that HD, this is common knowledge but this does not mean that we can't make a buck with it if we have some wind in our back.
There is some decent support between $71 and $69.35 or so. The fat horizontal red line is the POC... but it will move depending on how wide is your chart. The stock is also sitting on the blue Option Levels. Finally the Pink zone at the bottom is a fib level. It's easy to see based on the colors that price responded to the fibs pretty well. Just for the record, I am not a Fibs nuts. I am neutral about them. Many guys laugh at them but the bottom line is that many algos use them and that makes them "true." Just like floor pivots and other levels. Markets are sliced a million ways and Fibs are one of them.
Finally, the RSI below has not touched 40 yet... this is why I would not be surprised to see LOWE maybe drop a bit into the yellow zone where I drew a wiggly red line. If you got back on your own charts with the RSI you will see that Lowe (like so many stocks) likes to touch 40 on the RSI before bouncing. If it slices down through 40, be careful.
Up to you but personally I won't get in $LOW before it closes (end of day) above the diagonal red line going down from the recent top. Basically where the X is. Decent volume would be nice.
The market is bit tricky right now with the new year coming, the Russia-Obama tension and Trump taking over so I am not jumping ahead of the train on this one. I want to see some buying at support first. and price above $71.12 as a minimum.


LOWAfter an initial bullish formation, LOW has gaped down below the ascending channel (as a result to earnings release).
Price gaped down into a cluster of price support (stipulated by the blue rectangle).
I am neutral currently on this stock until price has settled.


Nice possible ER move this week. Back down on the bottom side of the trading. One to watch this week. ER this week. 5/18

RETAIL WEAK CANDIDATE CLOSE TO CLOUD EARNINGS COMINGCCI AND PERCENT R BOTTOM RANGE SEE INOUR BOOK THE REASONS ON AMAZON HAVE SHORT AND MICRO CAP LONGS-RELATIVE STRENGTH WEAK-MONEY FLOW DECREASING-STOC ON DOWN SIDE-CLOSE TO BREAKING 50 MA-WEAK GROUP

Lows fails to break resistance After the most recent run up on Lows price failed to sustain a break through resistance set from previous highs. Good opportunity to short. Put a stop at the high from the mos recent high candle at $77.30.

LOW making new highsI looked at LOW a few weeks ago, just after it had gapped up past $60. For those who traded it on a short-term strategy a nice profit in excess of 100 points would have been banked. Those who took a longer-term stance will have seen their equity rise by 250 points plus - so far.
LOW continues to make new highs and, after a stickiness around $45-$55, looks to be on the move again. There was a similar move last year - although at the moment this one is proving to be more linear. Still a buy.

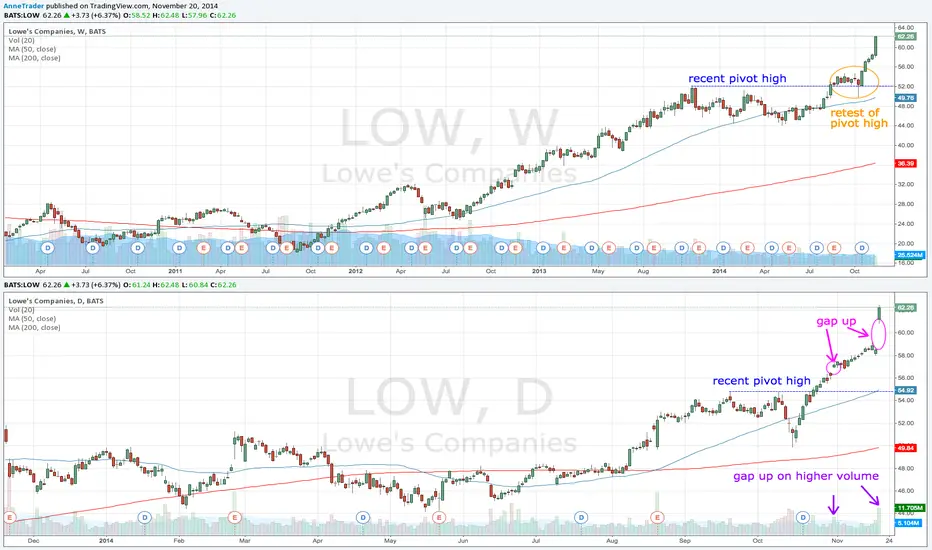
LOW going higherLOW has been trending up since late 2012 but the ride has not always been smooth. From November 2013 to August 2014 price was stuck in a prolonged pullback/consolidation around $50. Then in late August price broke above the November 2013 pivot high, retested it (see the weekly chart) with a spike below the resistance-turned-support and continued it's upward momentum.
On the daily chart LOW broke above the 19th September pivot high and a good opportunity to buy into this stock presented itself with the first gap up on 31st October. If you missed this then yesterdays gap offers a second opportunity.
Trading gaps is a near-term strategy but LOW looks in a position to trend over the longer-term, too, so this set-up could apply to either.

Lowe's Companies LOW price chart and fundamentalsNote the flatness of the revenues over the past few years and note how margins have fallen dramatically from their peak. All the while, the market cap has surged to nearly double what you might consider logical to pay for a company with almost zero growth in revenues and a weak position for profitability.
Would you pay $49 billion dollars for a company earning 2 billion a year?
Technically the chart is rolling over after a long, long, rally. Note the monthly chart above.
I already have a short recommendation on this chart on the daily time frame, and I thought it was relevant that LOW has the same lack of revenue growth as Best Buy (BBY). And all the talk about the real estate resurgence has investors all piled into this sector hoping for a profit boom to hit.
Thoughts? Comments? Next earnings due?
Tim 1:47PM EST, Jan 28, 2014 46.72 last -1.28 today or 2.65%
