Lowe's Companies, Inc. (LOW) forecastAfter the housing market is starting to see the impact of higher mortgage rates, LOW`s earnings beat and revenue which fell short of expectations aren`t enough to keep the stock price up.
I expect a retracement to the pre-pandemic level of $129 by the end of this year.
Looking forward to read your opinion about it.
LOWC34 trade ideas

Lowes Has Some Contractions Initiating. NYSE:LOW
Currently have been following this ticker for a moment. Do as you wish with this charting. Please hit the follow and like button if you enjoy my content thanks!

LOW (Lowes) - Support Bounce & Bullish Momentum Setup - 4 HourLOW (Lowes) stock price has double-bottomed above $200 trendline & horizontal support.
Entry: $204.12
Profit Target +6% (exit): $216.43
Stop Loss -3% (exit): $197.92
Utilize stop loss, profit targets, position sizing, and risk management.
Note: Many stocks and ETFs have already rallied up for the past two weeks, which makes this stock a potential laggard play.
If the S&P500 stock index pulls back down for technical or fundamental reasons, LOW (Lowes) stock may pull back down as well overriding this technical chart setup.
All content is Not financial advice. Educational example only. Trade at your own risk.

$LOW with a Bullish outlook following its earnings #Stocks The PEAD projected a Bullish outlook for $LOW after a Positive over reaction following its earnings release placing the stock in drift B with an expected accuracy of 57.14%.

LOW: Best Time to ShortLOW has hit resistance of the previous channel it was once in and now I expect big moves down. First PT is back to 206, then 190.
Not Financial Advice


Earnings watch 2/23 pre-marketEarnings watch 2/23 pre-market:
LOW
OSTK
BCRX
TJX
PBR
BHC
MNDY
JACK
TAP
HFC
Do your own due diligence, your risk is 100% your responsibility. This is for educational and entertainment purposes only. You win some or you learn some. Consider being charitable with some of your profit to help humankind. Good luck and happy trading friends...
*3x lucky 7s of trading*
7pt Trading compass:
Price action, entry/exit
Volume average/direction
Trend, patterns, momentum
Newsworthy current events
Revenue
Earnings
Balance sheet
7 Common mistakes:
+5% portfolio trades, capital risk management
Beware of analyst's motives
Emotions & Opinions
FOMO : bad timing, the market is ruthless, be shrewd
Lack of planning & discipline
Forgetting restraint
Obdurate repetitive errors, no adaptation
7 Important tools:
Trading View app!, Brokerage UI
Accurate indicators & settings
Wide screen monitor/s
Trading log (pencil & graph paper)
Big, organized desk
Reading books, playing chess
Sorted watch-list
Checkout my indicators:
Fibonacci VIP - volume
Fibonacci MA7 - price
pi RSI - trend momentum
TTC - trend channel
AlertiT - notification
tickerTracker - MFI Oscillator
www.tradingview.com

Lowes going Low. LOW Yes.
We are not in the business of getting every prediction right, no one ever does and that is not the aim of the game. The Fibonacci targets are highlighted in purple with invalidation in red. Fibonacci goals, it is prudent to suggest, are nothing more than mere fractally evident and therefore statistically likely levels that the market will go to. Having said that, the market will always do what it wants and always has a mind of its own. Therefore, none of this is financial advice, so do your own research and rely only on your own analysis. Trading is a true one man sport. Good luck out there and stay safe!

LOW H&SLOW appears to be developing a head and shoulders pattern on the daily chart. I hate that this stock has run up this far, but fibs have shown us that our opinions don't seem to matter. If this a H&S pattern, expect a fall to $202 in the next month or two.

Long LOWLowes has multiple gaps to fill to the downside which I hate because I eagerly want to short this stock, but I do not believe this rocket has run out of fuel just yet. If LOW breaks out of the ascending channel, we will find ourselves scratching our heads while LOW moves to 271, then possibly a final target of 293 before I will consider shorting this stock.
Not financial advice
Happy trading

LOW Dividend run up idea NYSE:LOW has been getting positive coverage from analysts. The announcement from Nike suggesting supply chain disruptions are easing also gave $LOW a boost. Lowe’s has a ex. Dividend date of 1/18/22 and pays out on 2/2/22 $0.80 - Street insider. This should also attract more institutional investors if the market continues to be risk on.

Lowes looks ready for a correctionMonday lowes closed with a bearish engulfing candlestick pattern at the top of its rising wedge. Today lowes loss support of that rising wedge and closed with higher selling pressure. Monthly RSI hit 85 last week. if you look at the history of lowes monthly RSI you'll see a pattern where this is a correction around 80-85 on the RSI.
Today makes 2 red candles if we close tomorrow in the red that would mean 3 black crows which would further confirm the reversal..
Let's see what happens

Long $LOW CMP $252.35Long $LOW CMP $252.35. Good long term stock. Nice uptrend. Continuation will take price to $260-$265 area. Expect price consolidation after run. Gap up on recent earning report. Price may come down a little after reaching $260 area.

$LOW | 12/13-12/17 | Watchlist #4 $LOW $260 bounce
(Bounce off 260 for calls)
Technical analysis: Bull flag breakout on the hourly chart
News catalyst: "Lowe's holds a Financial Outlook event. The home improvement retailer is expected to focus some of its commentary on operating margin opportunities. Expect some analysis following the event on whether or not Lowe's can close the margin gap with Home Depot (NYSE:HD). Shares of Lowe's jumped 6% last year after the event featured some strong guidance." - Seeking Alpha

LOWES & HD to lead the last rally LOW 268 HD 429/436 The dow could make a new high as well as sp . WILL POST AS NEEDED

$LOW with a Bullish outlook following its earnings #Stocks The PEAD projected a Bullish outlook for $LOW after a Positive over reaction following its earnings release placing the stock in drift B with an expected accuracy of 66.67%.
If you would like to see the Drift for another stock please message us. Also click on the Like Button if this was useful and follow us or join us.

LOW BreakoutLow made another breakout
Breakout of 6 Month Long Cup & Handle Pattern
Price well above 200DMA
Decent Volume

Fine SpikeWe spiked up out of the open window. As this is a new high we may expect further gains. A very short term retracement cleared the way for this in the short run.


LOW is making a cup of joeI was watching HD and it hit me that I should take a look at LOW too. So glad I did. It is on my watch list as I am confident that it is forming a cup & handle. If you look to the left, you will see a previous similar cup & handle that played out beautifully. I think the small difference is that there is no gap to fill. But of course we have to watch and play accordingly. When the price holds above $210.... I'm in like Flynn. Are you going to get a cup too?
Play Idea:
$220 -230C
$240 PT
45-60 day play


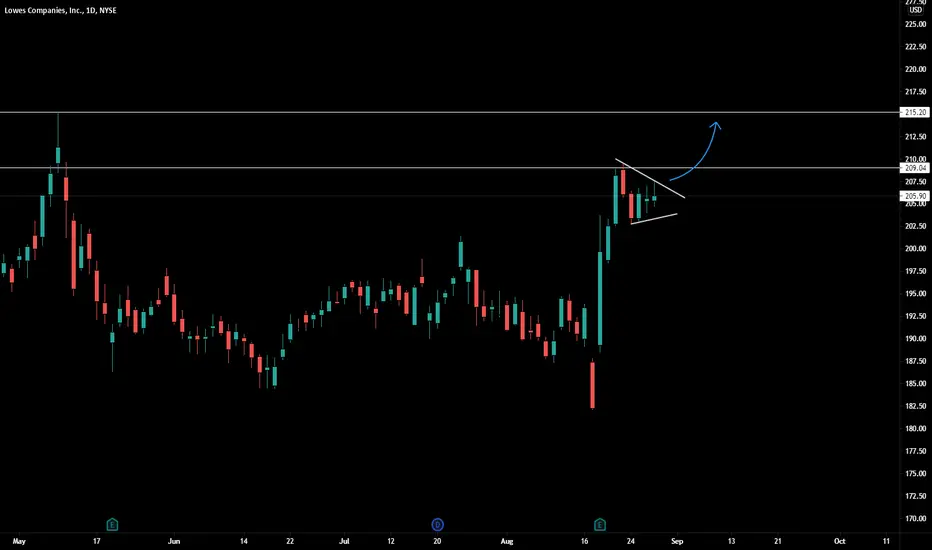
LOW flaggingNice symmetrical triangle / flag forming after a crazy few days last week.
It has very strong resistance above ( 209 and 215.20)
However if we break the triangle, we might see a strong push towards ATH
<TradeVSA> Pullback in Weekly chart. Breakout Soon?Sign of Strength in the chart:
1. Reaccumulation with Sign of Strength in daily chart
2. Green Pentagon High Volume
3. Strong uptrend with pullback in weekly chart
Disclaimer
This information only serves as reference information and does not constitute a buy or sell call. Conduct your own research and assessment before deciding to buy or sell any stock
