META is the KEY this week 🗝 Big money seems to have placed a lot of money on the $225 PUT options...META is a powerhouse so play with caution against this upward trend. I personally would only take a small position below $316 to play the Gap fill down to $301.....At $300 area once base is formed load some $355 CALLS long hold positions
M1TA34 trade ideas

META: Potential Early Bearish C Entry on ABCD PatternMETA is showing heavy amounts of MACD Hidden Bearish Divergence and is Extremely Overbought on the PPO after making a 0.786 Fibonacci Retrace of the 2021 Highs and now it is potentially looking to end the BC Wave and begin a CD Wave, which would take it all the way down to the 1.272 Fibonacci Extension located at the $23.56 level.

Long 294Looking bullish with sl 258 and target 294 and if sustain above 294 then 52 week high will break NASDAQ:META

METAHi, Look at this mega trend line from 2013 till 2021 i think price will retrace from this yellow line ......
stay safe and peace

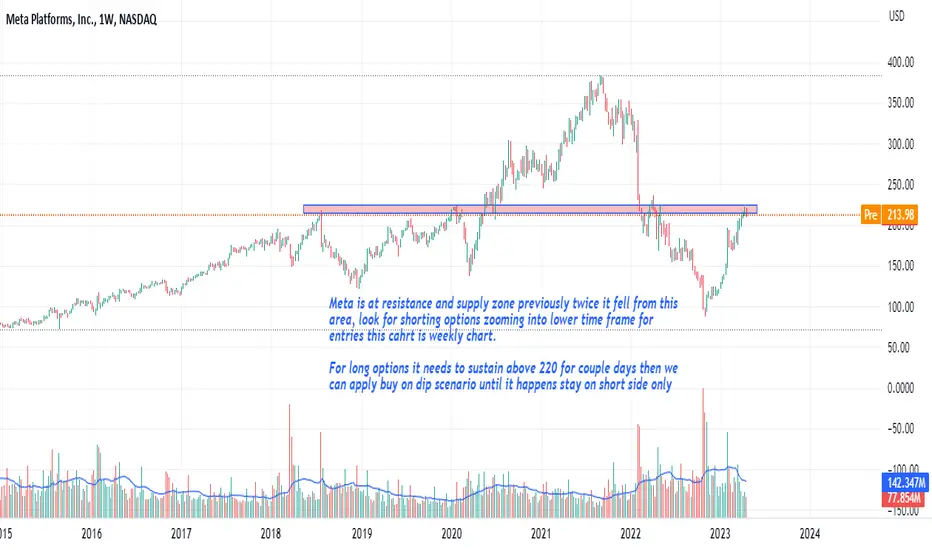
Meta is at resistance and supply zoneNASDAQ:META
Meta is at resistance and supply zone previously twice it fell from this area, look for shorting options zooming into lower time frame for entries this chart is weekly chart.
For long options it needs to sustain above 220 for couple days then we can apply buy on dip scenario until it happens stay on short side only
Meta Earnings are out earnings are great ,but lets not forget -META is investing huge amounts of money in the metaverse and the AR glasses development -huge resources from the company are currently allocated to these 2 developments.
Trade setup:
Gap to be filled up till 310$.
Pending order entry at 310
Stop loss 315 - above candle body after gap is complete (5$ SL)
Take Profit 260 (the yellow gap is our target - not inside the gap on the upper border)=50$ profit
1 lot = 100 stocks // Leverage 1:10
entry 310 X 100 shares = 31,000$ / 10 leverage = 3100$ required margin
Take profit - 50$ X 100 shares = 5000$ profit
Stop loss -5$ X 100 shares = 500$
Risk / Reward = 500 / 5000 = 1/10 (!!!)
ROI = profit / required margin = 5000$ / 3100$ = 1.6 aka 160% return (!!!)
this is a high potential trade with a short SL and a pending order entry which allows us to modify and adjust the trade at real time
This is NOT an investment or financial advice! trading should be done only with money you can afford to lose ! We recommend practicing on a demo for several months before opening trades with real money.

META STOCK UP 7% AFTER REPORTThe social media giant's second-quarter results encouraged investors as ad revenue surged, the company is embracing AI, monetization of Instagram and Reels.
→ Facebook now has 2.06 billion daily active users, up 5% from a year ago. And taking into account Instagram and other applications — 3.07 billion, which is 7% more.
→ At the same time, the number of employees decreased by 14% compared to last year to 71,000 people. Zuckerberg said the austerity program will run until 2024.
Amid the data, META's stock price jumped 7% in premarket trading. The META stock chart shows that:
→ today the price should update the high of the year;
→ with this sharp momentum, the bulls get the opportunity to gain a foothold above the psychological level of $300, pushing off from the support around $290;
Possible resistance level:
→ the $350 psychological mark, where the 2022 high is approximately located.
Possible support levels:
→ median and lower limit of the active ascending channel;
→ the $305 level that had an impact on the price in July.
According to the WSJ, analysts see an average target price for META's stock at around USD 330, but given the company's performance as evidenced by the report, the target price could be revised upwards by analysts.
This article represents the opinion of the Companies operating under the FXOpen brand only. It is not to be construed as an offer, solicitation, or recommendation with respect to products and services provided by the Companies operating under the FXOpen brand, nor is it to be considered financial advice.

$META EARNINGS Analysis, Key Levels & TargetsNASDAQ:META EARNINGS Analysis, Key Levels & Targets
Implied move… OMG, I meant to post this earlier… Oh well… let’s see what happens…
💃🏻
Meta long Ernings hit 52 week High New 52-week highs this week, powered by the Dow which, on Friday, extended its streak of positive days to ten — something the blue chip index has not done in almost six years. The Dow has been powered by, among other things, a slew of corporate financial results, particularly from the banks, which showed not only improved profitability, but also strong guidance for the next quarter and full year.
I have explained 2 bullish scenarios,1 bearish(worse case).
Bullish:
higher highs higher lows
poc uprising
volume increasing
capital flow rising
In case the Take profits hit, and we have increased volume, I will ride the trend.
I will only take profit 10% of the meta portfolio and let the profit run.
Exit :Stop loss or trend change signal

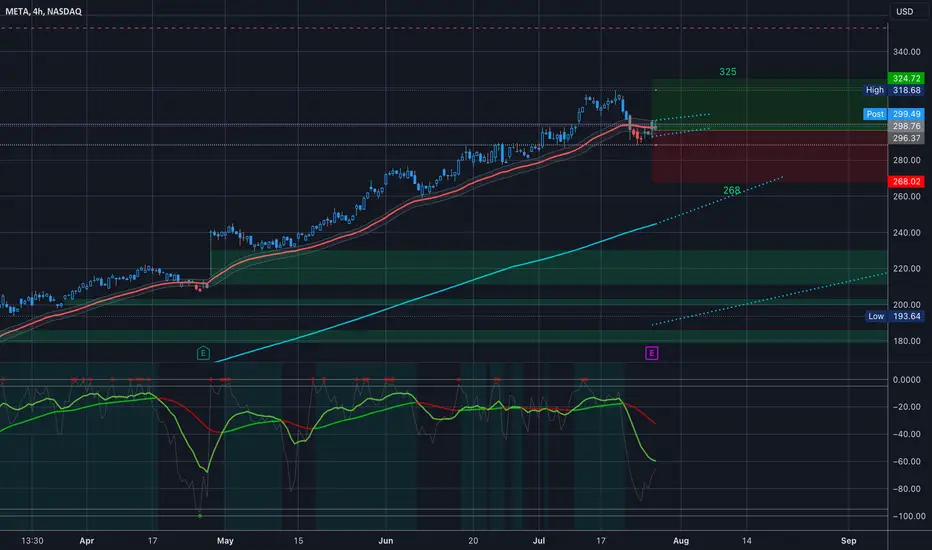
META Entry, Volume, Target, StopEntry: with price above 316.24
Volume: with volume greater than 30M
Target: 333.91 area (this is an area, no guarantee it reaches this price, but you should be selling on the way up)
Stop: Depending on your risk tolerance; Based on an entry of 316.25, 307.40 gets you 2/1 Reward to Risk Ratio.
This LONG swing trade idea is not trade advice and is strictly based on my ideas and technical analysis. No due diligence or fundamental analysis was performed while evaluating this trade idea. Do not take this trade based on my idea, do not follow anyone blindly, do your own analysis and due diligence. I am not a professional trader.

Meta Mega GapThe Meta Mega Gap was made back in January 2022. I started my reaccumalation of this stock around the $100 area. I started to sell off at the $200 area. I will keep a small bag as we start to head into the Mega Gap. I am well aware of the gaps below. There is still one down at the $100 level as well.
I keep my trade ideas simple on the macro time frames. Just need to be patient and follow the trend.

META TRADEMeta broke out of my 15m range, confirming buys. Saw confirmation on the 1 min TF. That demand on the 1min that was mitigated confirmed that price shouldn't break below 292.60. Got filled around 293.31. Beautiful play. Done for the day.

Meta Platforms, Inc. (META) in an almost perfect bullish rally
Shares in Meta Platforms, Inc. (symbol ‘META’) have performed in an almost perfect bullish rally throughout the whole of the second quarter of the year with gains of more than 45% outperforming both the S&P 500 and the Nasdaq. The company is expected to report earnings for the quarter ending June 2023, on Friday 26th of July after market close. The consensus EPS is $2,85 compared to $2,46 in the same quarter last year.
“ The tech giant is going full force in investing into AI related products in an effort to be one of the big companies that provides innovative products to their clientele. In a partnership with Microsoft,” says Antreas Themistokleous, an analyst at Exness. “Today, at Microsoft Inspire, Meta and Microsoft announced support for the Llama 2 family of large language models (LLMs) on Azure and Windows. Llama 2 is designed to enable developers and organizations to build generative AI-powered tools and experiences. ” (from official Microsoft website)
Technical analysis shows the price has been trading in a bullish momentum since the beginning of the year without any clear signs of a full trend reversal. The Stochastic oscillator is in the extreme overbought level for the last 2 months while the price is approaching a strong technical resistance level of $320. This area consists of the 78.6% of the weekly Fibonacci retracement level, the upper band of the Bollinger bands as well as the psychological resistance of the round number.
Apart from the overbought Stochastic there are no other signs of a correction in the near short term. The moving averages also confirm the bullish trend since the faster ones ( 20 & 50) are trading well above the slower 100 simple moving average.

META - Parallel Channel DownfallHowdy Traders!
This is a short post to notify you guys on the downwards break of the parallel channel for $META. The price target is around $278.49.
Bona Fortuna!

Chance to CorrectWe have almost reached the temporary high from end of August 2020 again which was valid until March 2021. This may serve as resistance now the more that it has been successfully tested in November 2021. The decisive outbreak in January 2022 led to e steep fall having persisted until November 2022. This has been corrected now with an impressive rise for over 1/2 year.
This rise has been uncorrected up to now and may run out of steam soon. A Fibonacci correction of the rise is likely now. Let's see to what level.

META Is this the start of a significant correction?Since November last year we have been issuing a strong buy signal on Meta Platforms (META) and our most recent analysis on February 02 (see chart below) came with a huge final bullish warning while the price was still at $189.00:
The stock hit $320.00 last week, almost filling the gap with the 1W candle of January 31 2022 (practically META's start of collapse) and pulled-back. The big question on the market this week is, can that be the start of a greater correction?
Well technically it is testing today the first key support level, the Higher Lows trend-line (bottom) of the 6 month Channel Up pattern that started in late February. If broken, it is unlikely to see the 1D MA50 (red trend-line) hold.
The key (technical) reason behind it, is the massive Bearish Cross that got formed this week on the 1W MACD. This is a major development as it is a rare event that always initiated a rather notable pull-back. More specifically, in the past five (5) years, we have had another six (6) 1W MACD Bearish Crosses, all making a Lower Lows after it. The minimum correction was -17.33% while the maximum -43.50%. Practically META made its large corrections (-43.50%, -38.60%) when it faced legal action and during the pandemic. The rest standard (technical) pull-backs ranged from -17.33% to -19.70% (also -28.15% on the last Bearish Cross but fundamentals were also present).
This is the reason we expect a pull-back below the 1D MA50 if the Higher Lows of the Channel Up fail (to close 1D candles above it). The minimum projected correction range of -17.33% would give us a pull-back to $265.00. A -19.70% would give $256.00.
That would start making META a technical buy again, where long term investors can start applying buying strategies with a tolerance level up to the 1W MA50 (blue trend-line).
-------------------------------------------------------------------------------
** Please LIKE 👍, FOLLOW ✅, SHARE 🙌 and COMMENT ✍ if you enjoy this idea! Also share your ideas and charts in the comments section below! **
-------------------------------------------------------------------------------
💸💸💸💸💸💸
👇 👇 👇 👇 👇 👇
