MMMC34 trade ideas


Support points and how to identify themHi again, so if you take a look at the horizontal line in the chart above, you might realise that it is a support point in the chart(MMM).
What is a support point? Well, it is actually an indication that tells you if the company is going to go higher or lower. But there is still a chance that the market might break the support point, just like a resistance point, so don't always rely on it!
How to identify one:To identify a support point, you have to see if there is a point where the stock market constantly bounces off on a certain period of time. And you can use a horizontal line to indicate it like what I did in the chart above
I hope you find this useful!

Trading Basics: Support and Resistance pointsHi traders, today I am going to teach you a very basic and effective indication that you can use when trading, and it is called Support and Resistance points.
Support and Resistance points tell you whether the company is going to go up, or if it is going down. If you would like to know more about the Support and Resistance points individually, you can take a look at my previous posts where I go deeper into the topic of Support and Resistance. If you would like just a brief over view of what it looks like you can take a look at the chart above NYSE:MMM

Trading Basics: Support and Resistance pointsHi guys, here is a basic indication that you guys might use(especially if you are new to trading)
And the indications are the Support and resistance points. This indication tells you if the market is going to go higher or lower. You guys can check my other posts that are more in specific in what is a resistance and support point. But if you are just looking for a brief example, you can take a look in the chart above(MMM). NYSE:MMM


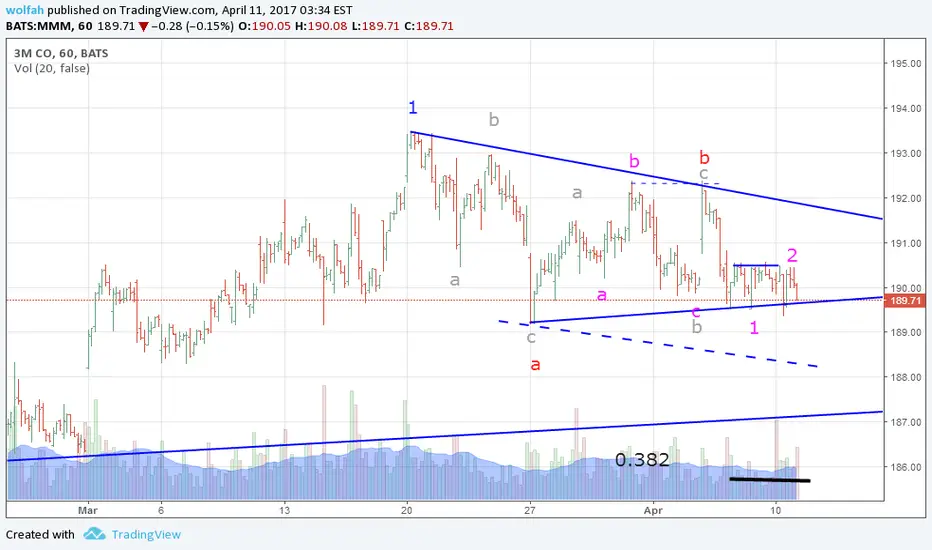
$MMM Longing for Target of $190MMM Chart says it all. Looking for 161.8% if we can break this wedge.


