MSFT Setup After EarningsEarnings season is heating up and Microsoft (MSFT) is once again in the spotlight. With its dominance in cloud and AI, the next move could be explosive.
Here’s how pro Im thinking my setting up:
🔹 $390 – A bold speculative entry for breakout hunters.
🔹 $365 – A defensive entry on post-earnings pullback to support.
🔹 $345 – The opportunity zone if a sharp drop offers value.
🎯 Profit Targets:
TP1: $410 – Psychological and technical resistance.
TP2: $426 – Momentum continuation level.
TP3: $445–$450 – Ambitious upside for long-term riders.
Whether you’re playing momentum or patiently buying dips, MSFT is offering clear levels. Stay sharp.
Disclaimer: This is not financial advice. All trading involves risk. Do your own research or consult a professional advisor before investing.
MSFT34 trade ideas

MSFT Q1 EARNINGSMicrosoft Earnings Presentation. We have a strong resistance area that we need to break. If we break through that area, we would move toward the second resistance zone, with strong support at 355.
If MSFT report strong earnings, the stock could move toward the $420 area, where it reached during the last earnings release.

Microsoft in Focus Ahead of Key Earnings, AI Outlook Under WatchMacro:
- Microsoft (MSFT) climbed on cautious optimism ahead of major earnings and economic data.
- Four of the “Magnificent Seven,” AMZN, AAPL, META, and MSFT, are set to report, with investors focusing on Microsoft (MSFT) today.
- Wall Street expects EPS of 3.22 USD and revenue of 68.44 B USD, both up YoY. Microsoft’s strength in AI, cloud, and enterprise software, along with its continued investment in AI talent and solid dividend history, makes this a closely watched report.
- Key drivers will be its results, AI/cloud growth outlook, and forward guidance, while any surprises could shift the stock sharply.
Technical:
- MSFT recovered and tested the resistance at around 396, confluence with EMA78. The price is sideways, and we await a clearer breakout to determine the following direction.
- If MSFT breaks above 396, the price may approach the following resistance at 405, confluence with the 100% Fibonancci Extension.
- On the contrary, remaining below 396 may prompt a retest to the support at around 378, confluence with the broken descending channel.
Analysis by: Dat Tong, Senior Financial Markets Strategist at Exness

April 29 Trade Journal & Stock Market AnalysisEOD accountability report: +686.25
Sleep: 8 hour, Overall health: :thumbsup:
Overall a decent day, but signals felt iffy today.
**Daily Trade Signals based on VX Algo System**
— 10:00 AM Market Structure flipped bullish on VX Algo X3!
10:27 AM VXAlgo ES X1 Sell Signal (double signal) :x:
1:08 PM Market Structure flipped bearish on VX Algo X3! :x:
1:51 PM Market Structure flipped bullish on VX Algo X3!
— 2:20 PM VX Algo ES X1 Sell Signal :x:
— 3:38 PM VXAlgo ES X3 Sell Signal (Double signal)
Next day plan--> Over 5470 = Bullish, Under 5470 = Bearish
Video Recap -->https://www.tradingview.com/u/WallSt007/#published-charts

Trading Analysis for Microsoft**Current Price:** $387.3
**Direction:** **LONG**
**LONG Targets:**
- **T1 = $395.0**
- **T2 = $405.0**
**Stop Levels:**
- **S1 = $383.0**
- **S2 = $376.0**
---
**Wisdom of Professional Traders:**
This analysis synthesizes insights from thousands of professional traders and market experts, leveraging collective intelligence to identify high-probability trade setups. The wisdom of crowds principle suggests that aggregated market perspectives from experienced professionals often outperform individual forecasts, reducing cognitive biases and highlighting consensus opportunities in Microsoft.
**Key Insights:**
Microsoft is demonstrating robust growth potential, particularly buoyed by its increasing investments in AI infrastructure and cloud computing services. Traders see the stock primed for a continuation of its upward momentum due to growing demand for AI applications across industries and Microsoft’s advancements in integrating AI technology into its product ecosystem. Institutional confidence remains high, with analysts highlighting key drivers such as Azure's market share expansion and strong profitability metrics.
Near-term momentum ahead of earnings is supported by key technical indicators and market sentiment. Resistance at $390 and psychological levels around $400 are being closely monitored by traders. Sustaining movement above these levels could lead to further upside potential that traders are ready to capitalize on.
**Recent Performance:**
Microsoft's stock has been outperforming many peers in the tech sector, consistently trading above its 20-day and 50-day moving averages. This indicates short-term bullish momentum, though it has struggled to break above its 200-day moving average. The consolidation phase observed recently suggests that market participants are awaiting pivotal news such as earnings results to initiate significant directional moves. A notable surge in buying interest has also been seen across its options market, signaling optimism among institutions and retail investors alike.
**Expert Analysis:**
Analysts have been praising Microsoft's execution in fulfilling long-term AI strategies, which could potentially add billions to future revenue streams. Growth in cloud services led by Azure and partnerships with OpenAI further underline the company’s strategic edge in the evolving tech landscape. Technical indicators like RSI and MACD also signal bullish sentiment, with key support levels well-defined at $376 and $383, safeguarding downside risks. Many experts agree that a robust quarterly earnings beat or upward revision of guidance could ignite momentum toward the $405-$413 range.
**News Impact:**
Anticipation is building ahead of Microsoft's earnings announcement, where traders are expecting a strong beat on both revenue and EPS metrics. Positive sector-wide developments in generative AI, alongside broader macro trends benefiting tech, have left investors optimistic about the stock's prospects. Any updates on Microsoft's AI-driven initiatives or its integration into major product lines could significantly impact future share price movements. Additionally, the regulatory environment around AI technologies is being closely monitored as it could influence long-term valuations.
---
**Trading Recommendation:**
Microsoft is well-positioned for long-term bullish momentum, with near-term upside heading into its earnings report. Clear support levels are established at $376 and $383, providing safety nets for traders while resistance levels of $395 and $405 present opportunities for potential gains. This setup aligns with expert analysis and institutional sentiment, making a LONG trade favorable for those seeking an entry point into a high-performing tech giant with strong fundamentals.
```

Msft trading I deaHi traders I hope you all doing good,I decided to drop atleast few long term investment analysis this morning,as you can see all mag 7 were going down during tarrif soo after this massive pill back as n investor it was not a threatening but n opportunity to buy lower as many companies were expensive n risky to position yourselfs higher now is your time to own atleast one of mag 7 companies,they are very cheap to invest in though compared to were it was early this year so do what you have to do thank you 😊

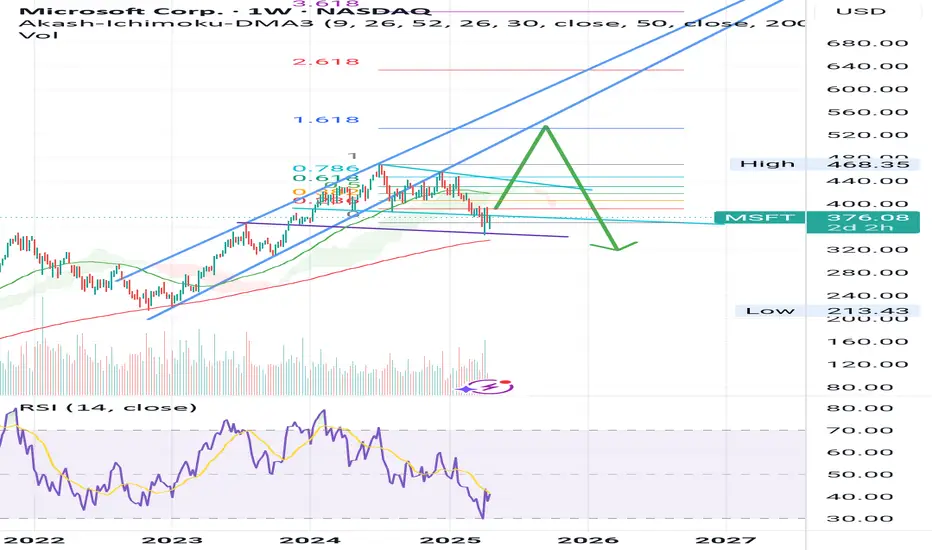
$MSFT : A 'Teflon' stock refusing to budge under pressureI promised multiple times that a detailed analysis of NASDAQ:MSFT will be published. Its time, today we analyze the levels to watch for and the future price points in this stock.
A large cap stock like NASDAQ:MSFT is a difficult ship to navigate. During the recent turbulence the stock lost almost 33% of its value. Even during these times, it never broke below the prior cycle highs of 345 $ in contrast to other MAG7 stocks like NASDAQ:TSLA which then led to more than 50% downturn in the stock. But as the headline says NASDAQ:MSFT is Teflon stock with resistance to go down. In the weekly chart we see that the stock never broke below the midpoint of the upward sloping regression band channel which is @ 375 $.
Now where does the stock go from here? If we plot the Fib levels on NASDAQ:MSFT we see that it is firmly at 0.382 which lies at 392 $. Next level is at 415 $, and we have an earning catalyst upcoming for NASDAQ:MSFT and if the stock closes above 425 $ then we can easily touch 422 $.
Verdict : NASDAQ:MSFT keep on DCAing. Earnings quality with low volatility.

MSFT Downtrend Over?Gray support is holding the price drop.
Yet, in my primary count, I´m still considering this is blue 4 correction.
Statistically, wave C usually ends with divergence, and we don't see it on the daily or the 4H timeframes.
So, I'll stick to this count as long as price stays below wave 1 (412.29).

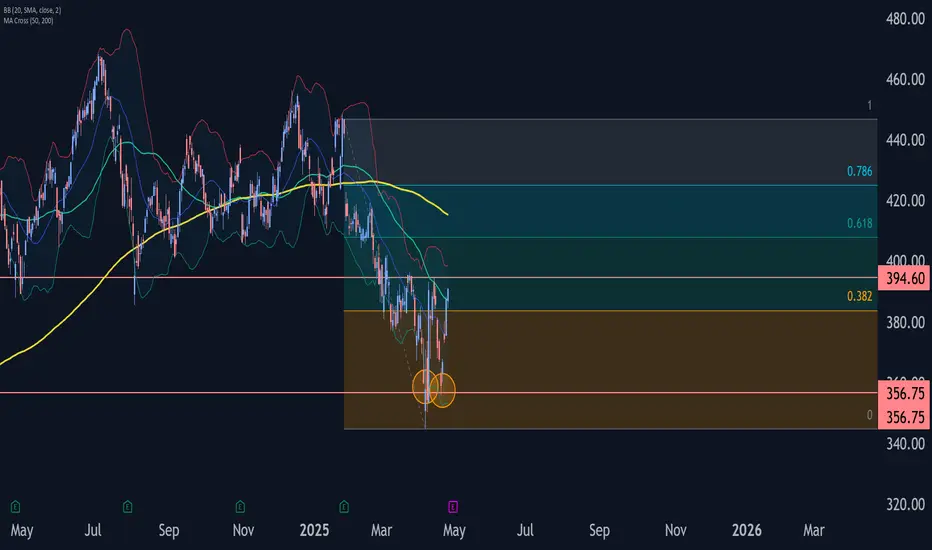
Microsoft Wave Analysis – 25 April 2025
- Microsoft rising inside impulse wave i
- Likely to test resistance level 394.60
Microsoft continues to rise inside the minor impulse wave i which started earlier from the support area between the key support level 356.75 and the lower daily Bollinger Band.
The active impulse wave i belongs to the c-wave of the ABC correction 2 from the start of April.
Microsoft can be expected to rise toward the next resistance level 394.60 (which reversed the previous waves iv and a).
Microsoft's Downtrend Poised for Deeper RetracementsMSFT 4D TECHNICAL ANALYSIS 📉
OVERALL TREND
📉 DOWNTREND — Confirmed by the descending pivot structure, cluster of recent lower highs, and bearish rejection from the 430–455 zone. The downtrend is confirmed with a moderately confident score of 23.8%, with a Trend Score of -0.50.
🔴RESISTANCE ZONE
🔴 468.3500 — SELL STOPLOSS | PIVOT HIGH
🔴 455.7494 — SELL ORDER 2
🔴 430.2472 — SELL ORDER 1
🎯ENTRIES & TARGETS
🎯 381.6944 — SELL ORDER & | TP 1
🎯 340.8905 — SELL ORDER & | TP 2 | MID-PIVOT
🎯 310.8399 — SELL ORDER & TP 3
🎯 264.4180 — EXIT SELL & TP 4
🟢SUPPORT ZONE
🟢 253.2621 — BUY ORDER 1
🟢 226.1769 — BUY ORDER 2
🟢 213.4130 — BUY STOPLOSS | PIVOT LOW
✍️STRUCTURAL NOTES
Major lower high rejection seen near 455–468 zone—clearly defined by the last bullish failure to break above
Recent candles show moderate bullish defense near 380, but unable to create a higher high
All key short-term MAs (10–50) are bearish, with crossover confirmation stacking downward
Longer-term moving averages (100–200) show mixed signals; short-term selling strength remains dominant
Oscillators show mixed-to-weak bearish signals, with MACD and Awesome Oscillator suggesting negative momentum
📉TRADE OUTLOOK
📉 Bearish Continuation Bias with potential downside continuation toward TP3 @ 310.84 and TP4 @ 264.41
📈 Temporary bounce possible at 381.69–340.89 range, but expected to be corrective unless higher highs are confirmed
🔍 Watch for retest and rejection at 430.24 or 455.74 zones to validate reentry setups on the short side
🧪STRATEGY RECOMMENDATION
CONSERVATIVE APPROACH (Trend-Following):
— Entry: 381.69 (on rejection confirmation)
— TP: 340.89 / 310.84 / 264.41
— SL: Above 430.25
AGGRESSIVE REVERSAL PLAY:
— Entry: 253.26 (Buy Order)
— TP: 310.84 / 340.89
— SL: Below 213.41
“Discipline | Consistency | PAY-tience™”

MSFT is losing key levelsMicrosoft has lost some very important support levels. After falling by 10%, it rebounded to the former support area, which is now acting as resistance. Many investors took advantage of this move to exit at a better price than we saw recently. Unless the stock moves back above this level, the outlook for MSFT remains bearish, and we may soon see further surprises in the US tech sector.

MSFT NeutralFundamentals
- Large float and mega cap - insufficient potential for move
- Revenue growing for slowly
- EPS is expected to decrease
- P/E 30 which is acceptable for Growth stock but MSFT is more already value stock and historically has lower P/E 23
Technicals
- Trying to reverse with the market but overal stock looks less interesting
Not so cheap compared to alternatives, above center of Yearly ATR
Better await drop.
Entry
- 300
Stop
- 250
Take
- 400

MSFT at a Decision Zone – Bulls Trying to Take Control!Options GEX Outlook (04/22/2025):
* Current Price: $373
* IVR/IVX: 55.6 / 39.4
* Options Sentiment: PUTs 19.4% (moderately bearish but not extreme)
* GEX Walls:
* Support (PUT Wall): $352.50 (Highest negative NETGEX)
* Resistance (CALL Wall): $380 (69.1% GEX) – this is the most meaningful upside wall
* Implication: MSFT is hovering just under a high-interest gamma zone at $377.5–380. Option sellers may defend this area, making it sticky and resistant. However, if bulls can break and hold above $380, gamma flip pressure could fuel continuation toward $390.
Technical Analysis + Scalping Bias (1H + SMC Co-Pilot):
* HTF SMC Bias (15min): Bullish structure forming, but not fully aligned.
* Trend Strength: Weak to Mixed — price is reacting, but structure lacks full confluence.
* Market Structure: No clear BOS or CHoCH yet, indicating the need for a clean break before committing.
* Volume: Strong Momentum Spike (1.25x) supporting this bounce.
* RSI, MACD, BBP: All Bullish, indicating price strength, but no defined setup yet.
* EMA/VWAP Reaction Zone: Currently testing EMA9 and watching for confirmation.
* Strength Meter: ⚠️ Mixed bias — 2/5 score.
Trade Thoughts:
* Above 374–377.5: This is the short-term battleground. If MSFT can hold this area with volume support, it may move toward the 380–385 gamma wall.
* Below 367.5: Breakdown of this level would invalidate bullish bias and shift momentum back toward 360–355.
* No Clear Trade Yet: You're in a zone of indecision. Scalpers should wait for CHoCH + BOS or break of EMA support to lean into a direction.
Action Plan:
* ⚠️ Stay Patient — Wait for a clean structure shift (BOS/CHoCH) above 377.5.
* ✅ Watch Volume — Sustained volume could confirm a breakout.
* 🔁 Key Levels to Monitor: 367.5 (support), 377.5–380 (gamma wall resistance)
Conclusion:
MSFT is testing resistance near key option gamma walls. Structure is building, but lacks confirmation for a clean entry. If it clears 380 with volume and structure support, the breakout could get legs. For now, manage risk and wait for confirmation.
This analysis is for educational purposes only. Always do your own research and manage your risk before trading.

Microsoft Wave Analysis – 18 April 2025
- Microsoft falling inside impulse wave 5
- Likely to test support level 360.00
Microsoft continues to fall inside the minor impulse wave 5, which started recently from the key resistance level 392.50 (which also reversed the price at the end of March) standing close to the 50% Fibonacci correction of the downward impulse from January.
Impulse wave 5 is a part of the strong multi-month downward impulse sequence (C) from last December.
Given the clear daily downtrend, Microsoft can be expected to fall to the next support level 360.00, which reversed the price at the start of April.

MSFT: Long viewMSFT is a great stock, consistently and impressively growing in recent times, I really like it, and this is a great opportunity to .... SELL.
Distribution phase!
.
Lets wait for good entry!

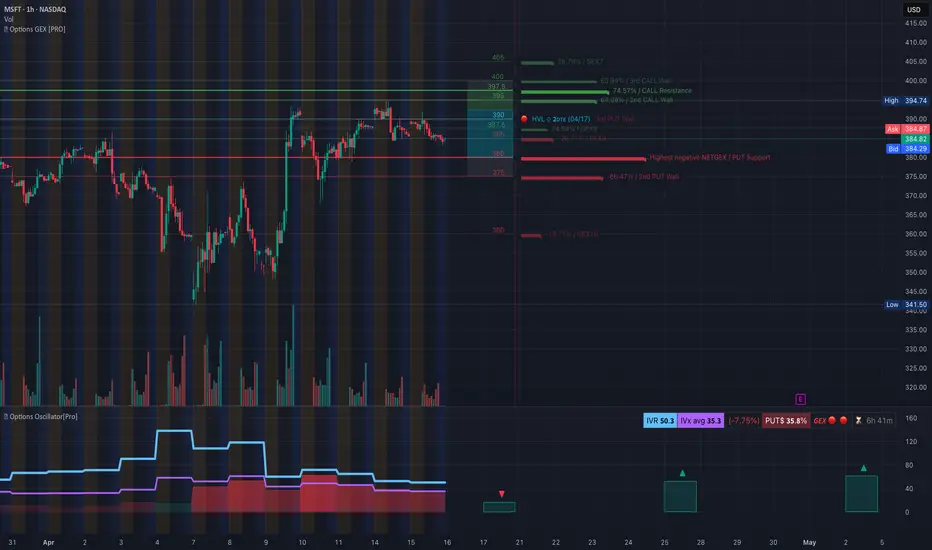
MSFT GEX Breakdown: Heavy PUT Signals Danger Below 380!🔮 Options GEX (Gamma Exposure) Insights – MSFT:
🟥 PUT Domination Increasing
* Highest negative GEX sits around 380–375, making this a critical gamma support zone where dealers are heavily hedged long gamma.
* If MSFT breaks below 380, expect amplified sell pressure as dealers adjust hedges, possibly triggering a quick flush to 360, where another GEX wall sits.
🟩 CALL Walls Stack at Resistance
* CALL Walls are stacked between 395, 397.5, and 400, forming a firm gamma ceiling.
* The highest positive net GEX resides near 395–400, making upward movement difficult unless IV spikes and hedging flips.
📉 GEX Sentiment Summary:
* IVR: 50.3 → Volatility expectations remain moderate.
* IVx: 35.3, trending –7.75% lower, suggests option pricing is cooling — but this can rapidly reverse if support fails.
* PUTs dominate at 35.8%, implying dealers are short gamma and could accelerate moves if price breaks either direction — especially down.
🎯 GEX Game Plan:
* Below 380: Watch for a sharp selloff toward 375, then 360 if flow intensifies.
* Above 390: Limited upside until 395–400 clears — CALL resistance is thick, expect rejection unless news or volume surge.
🕰️ Technical Analysis – 1H Chart (Supports the GEX View)
* Trendline Breakdown: Price has slipped below a rising wedge, and EMAs are flattening out — bearish.
* VWAP Rejection: Price is struggling under VWAP, showing institutional sell pressure.
* MACD: Flat but negative, trending under zero — no momentum shift yet.
* RSI: Below 45 and falling — still no divergence or strength building.
Support/Resistance Key Levels:
* Support: 380 (first GEX wall), 375 (heavy PUT support), then 360 (final wall).
* Resistance: 390 (VWAP area), 395–400 (dense CALL walls).
🧠 Final Thoughts:
MSFT is coiling near a high-risk gamma zone. With dealers holding heavy short gamma below 380 and no clear bullish reclaim on the chart, downside remains open. Bulls need to reclaim 390+ fast — or risk a gamma-led liquidation flush to 375 or lower.
This is a GEX-driven chart — the technicals merely confirm what options flow already warns: the path of least resistance is likely down, unless a surprise reversal ignites above 390.
This analysis is for educational purposes only and not financial advice. Always manage risk and confirm setups with price action.
Elliott Wave Analysis Signals Gains in Microsoft (MSFT)The short-term Elliott Wave outlook for Microsoft (MSFT) paints a bullish picture, suggesting the stock has room to climb after a key low at $338 on April 7, 2025. This level marked the end of a corrective phase, known as wave (II), following a decline that began on July 5, 2024. That selloff unfolded in a three-wave pattern, a hallmark of a correction rather than a bearish trend. Notably, the final leg of this decline, starting from the December 12, 2024 high, didn’t reach a typical Fibonacci extension (1.618), reinforcing the idea that the market remains bullish on Microsoft.
Since hitting the $338 low, Microsoft has rallied in a five-swing pattern, a structure called a motive sequence, signaling potential for further gains. The rally’s first leg, wave (1), peaked at $373.65, followed by a dip to $346.75 in wave (2). The stock then surged to $393.23 in wave (3), with a brief pullback to $367.80 in wave (4). Now, Microsoft is likely nearing the end of wave (5), completing a larger wave ((1)).
Looking ahead, a wave ((2)) pullback is expected to correct the rally from April 7, but as long as the $338 low holds, any dips should find support in a three-, seven-, or eleven-swing pattern, setting the stage for more upside. This suggests short-term pauses but a continued upward trend for Microsoft, making it a stock to watch for bullish opportunities.

MSFT at a Key Inflection Point! Will This Breakout Hold?Technical Analysis (1H):
* Trend Structure: MSFT is trading within a clean ascending channel. Price is currently hugging the upper trendline resistance, with higher lows confirming strong intraday buyer interest.
* Volume: Buying volume picked up significantly during the breakout on April 10 and has since stabilized as price consolidates near resistance — a healthy sign of continuation if bulls hold.
* RSI: RSI is trending above the midpoint and gradually rising, but not overbought — signaling room to move higher without immediate exhaustion.
* Key Resistance:
* 392.92 — Local high. If broken, potential to run toward 400 and 405.
* Gamma Wall sits at 405, which aligns with highest positive NETGEX and may act as a magnet for price.
* Support:
* 377.50 — Nearest support from HVL (High Volume Level) and Gamma Support.
* 367.80 / 348.29 — Stronger downside zones if price fails the channel.
GEX & Options Flow Insights:
* GEX Walls:
* 405 = Highest Positive NETGEX / Gamma Wall.
* Multiple call walls layered at 400, 405, and 410 — creating a strong bullish magnet above.
* Put walls concentrated below 377.5, but gamma intensity is lower until 355.
* Options Oscillator:
* IVR: 64.8 — moderately elevated.
* IVx avg: 46 — showing increasing volatility expectations.
* Put Positioning: 44.9% — almost evenly balanced with calls, slight lean toward downside hedging.
* GEX Sentiment: 🟡🔴🟢 — Mixed, but still slightly favorable for upside as long as 377.5 holds.
Trade Scenarios:
📈 Bullish Setup:
* Entry: Break above 393–395 with strong volume.
* Target: 400 → 405 (gamma magnet zone).
* Stop: Below 386 (channel midline break).
📉 Bearish Setup:
* Entry: Breakdown below 377.5 support.
* Target: 367.8 → 348.2
* Stop: Above 386 to avoid getting trapped by a bounce.
Option Trade Suggestion:
* Directional Call Debit Spread (Apr 17 expiry):
* Buy 395c / Sell 405c
* Risk-defined setup aligned with gamma wall targets.
* If bearish: Consider 375p / 360p put spread if MSFT rejects 393 and breaks below 377.5.
Final Thoughts:
MSFT is sitting on a powder keg of potential. Price is coiled under a resistance zone where gamma exposure aligns with bullish targets. If macro sentiment aligns, the breakout toward 400–405 could trigger a short-term momentum rally. But failure to hold the channel would mean a quick retest of 377–367 range.
This analysis is for educational purposes only and does not constitute financial advice. Always do your own research and manage risk appropriately.

Margin Meltdown & the Golden Surge: How Tech Cracks Fueled Gold?Margin Meltdown & the Golden Surge: How Tech Cracks Fueled Gold’s Breakout in April 2025
Fear-Driven Flight to Gold is Real
If margin calls continue and top stocks like Microsoft and NVIDIA keep showing weakness:
• Expect more bond market stress
• A persistently weak dollar
• And a sustained gold rally
Gold is the cleanest beneficiary of the current chaos. Every chart, every data point, every political move validates it.
////////=====////////
What’s Happening in the Stock Market and Trump’s Tariffs – Simple Summary (Updated & Validated)
1. Margin Loans:
Many investors borrowed money using their stock portfolios as collateral. For example, if someone owns $100,000 in Microsoft stock (now trading at $388.45), they could borrow up to 90% of that value — $90,000 — and use it to buy other stocks like NVIDIA ($110.93).
2. Margin Calls:
When the market fell earlier this month, Microsoft and NVIDIA dropped sharply. Brokers issued margin calls, forcing investors to either deposit more funds or sell off assets to cover their positions.
3. Forced Selling:
As stocks fell further, more investors were forced to liquidate. This increased selling pressure pushed prices down even harder.
4. Vicious Cycle:
The deeper the drop, the more margin calls got triggered, which led to even more forced sales — a self-perpetuating loop of destruction.
5. Bond Selling Instead of Stocks:
Some investors didn’t want to sell their stock positions and instead began selling bonds to raise cash — including even U.S. Treasuries.
6. Bond Market Shock:
This rare, broad-scale bond selloff shook up the entire fixed-income market — everything from corporate to government bonds dumped.
7. Rising Yields:
As bond prices fell, yields spiked. But this wasn’t due to strong growth — it was pure fear-driven liquidation.
8. Unexpected Dollar Weakness:
Usually, during times of crisis, the dollar strengthens. But not this time. The U.S. dollar fell, while currencies like the euro and Swiss franc gained. The Chinese yuan stayed weak under its own pressures.
9. Trump’s Reaction:
In response to the chaos, Trump’s administration paused tariffs for 90 days — a political move under pressure. But the damage to market psychology was already done.
10. Tax-Loss Harvesting by Smart Investors:
During the crash, savvy investors sold declining stocks like Microsoft to lock in tax deductions, then bought similar alternatives like NVIDIA to stay in the market while writing off losses.
Impact on Gold (XAU/USD) – Real-Time Validation
As of April 12, 2025, Gold (XAU/USD) is trading at:
$3,235.91 (+$60.13 for the day | +12.02% over the past month)
Let’s validate the theory with what actually happened:
1. Gold vs. Stocks and Bonds:
While Microsoft and NVIDIA were collapsing earlier this month, gold surged. This shift confirms a flight to safety — gold became the preferred hedge during equity and bond volatility.
2. Falling Dollar = Bullish for Gold:
With the dollar under pressure, gold became cheaper in foreign currencies — driving international demand and pushing prices even higher.
3. Rising Yields – But Driven by Panic:
Normally, higher yields compete with gold. But this time, yields rose because bonds were being dumped, not because of economic strength. That fear drove even more capital into gold.
4. Policy Uncertainty:
Trump’s late response and inconsistent trade policies fueled further market unease. That pushed more investors toward gold as a non-political store of value.
5. Liquidity Crunch Risk:
Some gold may have been sold during the panic to raise quick cash, but overall, the trend shows that gold held firm and then broke out even harder — a textbook crisis hedge move.
Real Example: Microsoft and NVIDIA Margin Trap
Let’s walk through the actual setup:
• An investor owns $100,000 in Microsoft (MSFT at $388.45).
• They take a $90,000 margin loan to buy NVIDIA (NVDA at $110.93).
• Early April:
• MSFT dropped below $320.
• NVDA fell under $100.
This triggers:
• Margin calls.
• Forced selling of both positions.
• Possibly even bond liquidation.
• And systemic panic across portfolios.
Result?
• Tech sold off.
• Bonds dropped.
• Yields rose.
• Dollar weakened.
• Gold exploded.
///////======//////
Impact on Gold (XAU/USD): Real Events, Real Movement
• Microsoft & NVIDIA Down: Confirmed panic in tech.
• Bond Selloff = Higher Yields: But from fear, not confidence.
• Weaker Dollar: Confirmed.
• Gold Breakout: Real.
• RSI above 70
• ADX shows trend strength
• Volume surging
• Price broke $3,200 and held
Gold moved exactly how a textbook safe haven asset should behave in this
//////======///////
XAUUSD market behavior and trader mindset:
1. Monday: Continuation After Breakout (Euphoria Phase)
Psychological Insight:
Traders and institutions are chasing momentum. After a clean breakout, FOMO kicks in, especially for those who missed the first leg. They buy pullbacks aggressively, creating a bullish Monday.
Projection: Bullish continuation
Range: 3,230 – 3,270
Bias: Buy dips
Reason: Momentum from last week’s breakout still pushing higher. RSI >70 but not topping, and no reversal pattern on daily chart. Weak USD persists.
2. Tuesday: Pullback from Overextension (Reality Check)
Psychological Insight:
Once price pushes too far, short-term traders start locking profits. This creates a dip. But smart money (institutions) sees the pullback as cheap entry — especially with no bearish reversal confirmation.
This is textbook reaccumulation psychology.
Projection: Intraday pullback, then bounce
Range: 3,250 – 3,280
Bias: Buy on VWAP pullback
Reason: Small retracement likely due to overextension. Support at VWAP (~3,219). Bullish engulfing pattern might trigger dip-buyers.
3. Wednesday: Retest / Breakout (Conviction Phase)
Psychological Insight:
After a healthy pullback and hold, traders regain confidence in the trend. Breakout traders load in here — and weak shorts get squeezed. This is where bullish conviction peaks, triggering high-volume moves.
Projection: Breakout attempt
Range: 3,265 – 3,310
Bias: Scalpers can long breakout
Reason: If momentum holds, this is likely the day gold retests highs and pushes through short-term resistance (~3,300 psychological + fib extension zone).
4. Thursday: Sideways Chop (Indecision / Distribution)
Psychological Insight:
Market participants are split. Some want to hold into the weekend; others fear a Friday sell-off.
You see hesitation, tighter ranges, and volume drop-off — classic signs of short-term indecision and distribution by early buyers.
Projection: Consolidation / Sideways
Range: 3,280 – 3,310
Bias: Neutral-to-bullish
Reason: After a breakout, price typically stalls for distribution/re-accumulation. Expect reduced volatility unless triggered by macro news (watch bond yields).
5. Friday: Final Move (Greed vs. Fear Showdown)
Psychological Insight:
End-of-week decisions are all about book-squaring. If the week was strong and the narrative holds, we get greedy breakouts into the weekend.
If uncertainty creeps in (e.g. Fed noise, geopolitical tension), profit-taking overrides conviction, leading to a dip.
Projection: Second leg breakout or profit-taking
Range: 3,270 – 3,330
Bias: Depends on Thursday’s behavior
Scenario 1: If Thursday consolidates tightly, breakout possible.
Scenario 2: If extended already, profit-taking dip possible into close.
/////=====/////
Weekly Summary:
• High probability: Gold hits $3,300 – $3,330 this week
• Support zones: $3,219 (VWAP), $3,175 (previous breakout zone)
• Resistance zones: $3,298 (fib cluster), $3,330 (round number magnet)
This projection isn’t just TA — it’s behavioral trading at its core, based on how traders actually react:
• FOMO,
• profit-protection,
• fear of reversal,
• and end-of-week positioning.
Every day’s move is driven by human emotion wrapped around market structure.

Immediate leap on MSFT! 🔉Sound on!🔉
📣Make sure to watch fullscreen!📣
Thank you as always for watching my videos. I hope that you learned something very educational! Please feel free to like, share, and comment on this post. Remember only risk what you are willing to lose. Trading is very risky but it can change your life!

MICROSOFT On 4th largest correction in 15 years. Buy or trap?Microsoft (MSFT) has corrected by -26.50% from its All Time High (ATH), representing the 4th biggest correction since June 2010, which was the first pull-ack after the historic 2008 Housing Crisis.
At the same time the 1W RSI hit the 30.00 oversold limit for the first time since that low of June 2010! Not even the Housing bottom didn't exhibit such low 1W RSI.
All while the current Tariff War correction stopped a little before testing the 1W MA200 (orange trend-line), which has been the long-term Support since 2011 and was last hit (for the 2nd time during that time span) in December 2022 during the previous Inflation Crisis.
As a result, this is a unique long-term buy opportunity for such a tech giant. The 2010 rebound hit the 0.786 Fibonacci level before pulling back while the rally that was initiated after the 2022 Inflation Crisis bottom reached +117.45%.
Based on the above, we have a medium-term Target on MSFT at $440 (Fib 0.786) and a long-term at $700 (+100%).
-------------------------------------------------------------------------------
** Please LIKE 👍, FOLLOW ✅, SHARE 🙌 and COMMENT ✍ if you enjoy this idea! Also share your ideas and charts in the comments section below! This is best way to keep it relevant, support us, keep the content here free and allow the idea to reach as many people as possible. **
-------------------------------------------------------------------------------
💸💸💸💸💸💸
👇 👇 👇 👇 👇 👇

Microsoft MSFT - What`s next?I mentioned a month ago this is a short for me, well dynamics changed in a very quick way, yes went went to a recession before tarrifs were done. But with the tarrfis the dynamics changed quickly. If tarrifs are resolved a huge uptrend is possible, if not resolved then it is not clear what the market will do so what`s the answer where we are going? At the moment NOWHERE. No hedgefunds are shorting at the moment due to high risk of liquidation if Trump posts something new, but also nobody wants to buy at this moment a lot because if he continues after the 90 days (except china) the gloabal tarrifs market drop is possible. But important to say there is much less risk on the downside than on the upside at this moment. Biggest risk was that europe punishes the American IT industry which would hit MSFT and AAPL the hardest, but this risk is now very low. So at this moment. Nobody wants to buy and nobody wants to sell until time comes and if nothing important happens I do think only then we will see what will happen. Slightly more bullish than bearish atm but only minimal. No data, no trade.
