NDAQ #001 ( Say Goodbye to Nasdaq Market !!! ) Hello dear traders.
Good days.
First of all thanks for your comment and support.
------------ ---------------- --------------
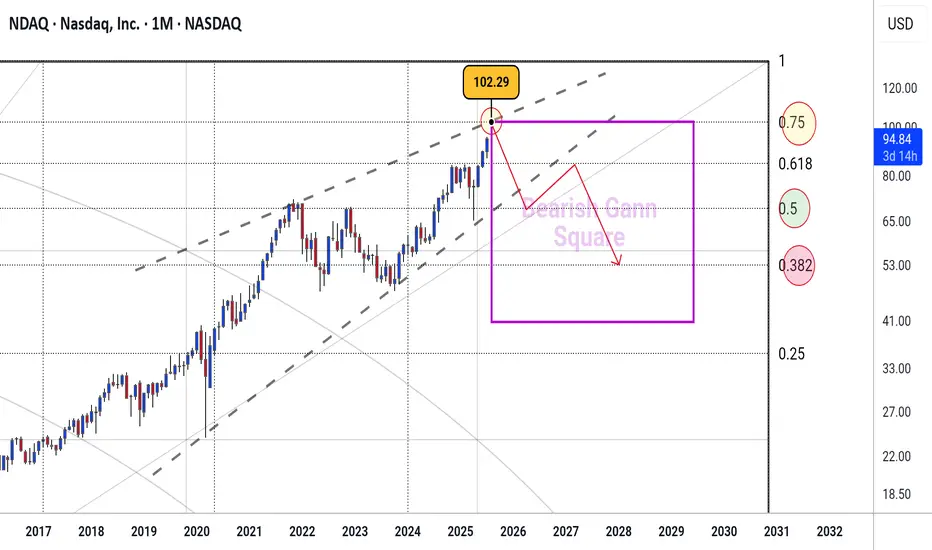
Today I want to analysis Nasdaq Market which on monthly Gann Square which is grown up highly close to the 0.75 Monthly Gann Box price level .
I can see sharp rises to fil
Key facts today
35,568.00
0.01 BRL
6.02 B BRL
39.89 B BRL
About Nasdaq, Inc.
Sector
Industry
CEO
Adena T. Friedman
Website
Headquarters
New York
Founded
1971
ISIN
BRN1DABDR002
FIGI
BBG00RHFHSN3
Nasdaq, Inc. is a holding company, which engages in trading, clearing, exchange technology, regulatory, securities listing, information, and public and private company services. It operates through the following segments: Capital Access Platforms, Financial Technology, and Market Services. The Capital Access Platforms segment delivers liquidity, transparency, and integrity to the corporate issuer and investment community by empowering clients to effectively navigate the capital markets, achieve their sustainability goals, and drive governance excellence. The Financial Technology segment offers platforms that improve the liquidity, transparency, and integrity of the global economy by architecting and operating the markets. The Market Services segment includes equity derivative trading and clearing, cash equity trading, fixed income, currency, and commodities trading. The company was founded by Gordon S. Macklin in 1971 and is headquartered in New York, NY.
Related stocks
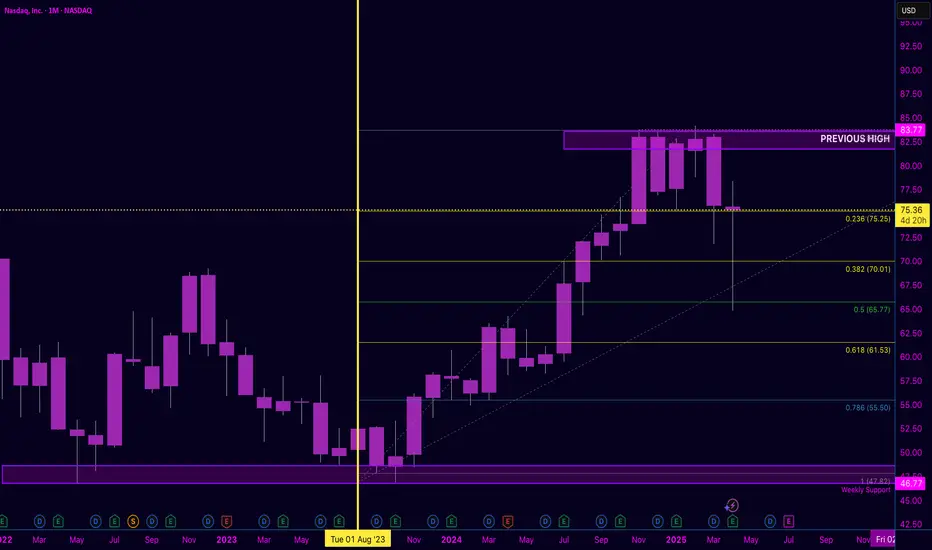
NASDAQ Monthly | Healthy Correction or Trend Shift?
Price has pulled back from the $83.77 previous high, now hovering right on the 0.236 Fib level at $75.25 — a critical area to watch.
🟣 Rejection at the top shows momentum cooling. 🟡 If support fails here, eyes shift to $70.01 (0.382) and possibly $65.77 (0.5) as next key levels.
This move may be

Nasdaq Ready to Fall==>-5%_-10%The Nasdaq Index started to rise with the help of the " Long Island " upward continuation pattern and made the New All-Time High(ATH) .
The Nasdaq Index is currently near the upper line of the Ascending Channel and has succeeded in breaking the Uptrend line .
Also, Regular Divergence (R

Nasdaq & RTX Charts Suggest Promising Growth AheadNASDAQ
After a powerful uptrend, the stock encountered a significant resistance around the 72 level and plummeted sharply thereafter.
Finding stability near the 47 level, the price surged within a Rising Wedge formation.
Typically, following the appearance of this pattern, a decline occurs pos

NASDAQ HTF SWING IS BULLISH NASDAQ UPDATE
-Heavily bullish
-Expect a pullback after BOS, currently price in between swing points( no mans land)
-Use H4 to confirm bearish OF to Sell entry opportunities

The Nasdaq reaches a critical resistance and could reverse.The Nasdaq is forming a falling triangle pattern. It has been in an uptrend since October 2023, as have the stocks that comprise the Nasdaq. At the moment, it is approaching the resistance line on the upside and could get rejected. What does this mean for the other stocks?
- On the 3-line indicat

NDAQ Retesting Significant TrendlineNDAQ has formed a clear descending triangle. Statistically more likely to see a breakdown, but not an extremely reliable pattern. The flat bottom changes the pattern from a bullish pattern to a more bearish one.
Breakout, with potential to retest ATHs? Or another retrace to recent lows, i.e. bottom

Nasdaq Possible MoveYou are correct, the Nasdaq is an index, not a stock. Here is an improved version of the sentence:
The Nasdaq index is currently trending within a bullish channel, indicating a positive outlook. I anticipate further price increases based on the chart analysis.

NDAQ - Make or Break SpotNDAQ Consolidating and is looking like it's in quite the make-or-break spot. Definitely will be keeping an eye on the Nasdaq and broader markets, the NDAQ has a double bottom off of the lower trendline, while simultaneously all other signs point bearish. Death cross on both the MACD as well as the 5

See all ideas
Summarizing what the indicators are suggesting.
Oscillators
Neutral
SellBuy
Strong sellStrong buy
Strong sellSellNeutralBuyStrong buy
Oscillators
Neutral
SellBuy
Strong sellStrong buy
Strong sellSellNeutralBuyStrong buy
Summary
Neutral
SellBuy
Strong sellStrong buy
Strong sellSellNeutralBuyStrong buy
Summary
Neutral
SellBuy
Strong sellStrong buy
Strong sellSellNeutralBuyStrong buy
Summary
Neutral
SellBuy
Strong sellStrong buy
Strong sellSellNeutralBuyStrong buy
Moving Averages
Neutral
SellBuy
Strong sellStrong buy
Strong sellSellNeutralBuyStrong buy
Moving Averages
Neutral
SellBuy
Strong sellStrong buy
Strong sellSellNeutralBuyStrong buy
Displays a symbol's price movements over previous years to identify recurring trends.
NDAQ4979763
Nasdaq, Inc. 3.25% 28-APR-2050Yield to maturity
6.77%
Maturity date
Apr 28, 2050
US63111XAE1
NASDAQ 20/40Yield to maturity
6.63%
Maturity date
Dec 21, 2040
NDAQ5372971
Nasdaq, Inc. 3.95% 07-MAR-2052Yield to maturity
6.58%
Maturity date
Mar 7, 2052
NDAQ5607193
Nasdaq, Inc. 6.1% 28-JUN-2063Yield to maturity
5.90%
Maturity date
Jun 28, 2063
NDAQ5607192
Nasdaq, Inc. 5.95% 15-AUG-2053Yield to maturity
5.74%
Maturity date
Aug 15, 2053
US63111XAJ0
NASDAQ 23/34Yield to maturity
4.93%
Maturity date
Feb 15, 2034
US63111XAD3
NASDAQ 20/31Yield to maturity
4.87%
Maturity date
Jan 15, 2031
US631103AG3
NASDAQ 2026Yield to maturity
4.59%
Maturity date
Jun 30, 2026
US63111XAH4
NASDAQ 23/28Yield to maturity
4.32%
Maturity date
Jun 28, 2028
XS236990664
NASDAQ 21/33Yield to maturity
3.83%
Maturity date
Jul 30, 2033
XS264367395
NASDAQ 23/32Yield to maturity
3.20%
Maturity date
Feb 15, 2032
See all N1DA34 bonds
Curated watchlists where N1DA34 is featured.

