NIKE34 trade ideas
ABC BullishEarnings are over until close to Christmas! Geez, time goes by too fast!
Possible stop under C or where you see support.
Pocket Pivot at top of gap
No recommendation

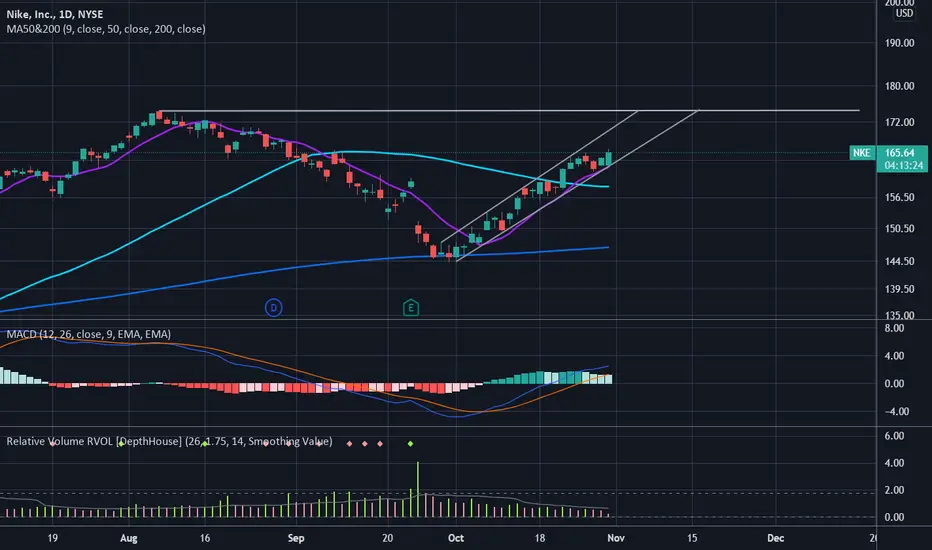
NIKE break out long projectionweekly uptrend price made a retest into 145 zone and took off. trend and lower lows broken easy to see on lower timeframe I'm projection Nike to go to previous weekly swing high 174.50 which would be nice area to take profit


0027 NKE:xnys - KC [4H] | OptionDate : Wednesday 20th October 2021
Time of trade (Malaysia Time) : 22:45
Scanner : My Keep an eye on Watchlist for KC
Entry Price : $1.06 (Stock price $158.10~)
Shares : 9
TP (Take Profit) : $1.74
SL (Stop Loss) : When mother stock reaches $153.74
*Prices are in $USD
Technique (Long Call/SPV/ SCV /Iron Condor/Long Put etc) : Long Call
Expiry Date : Friday 29 Oct 2021 (9 days)
Option Entry Price : $1.06
Strike Price : $160.00
Delta : 0.33
Contract : 9 (900)
Comments :
- What's on your mind? (What do you think about what you are doing/did?)
KC reaches ranting. Hopefully it will rise to the sky within 2-3 days, since I would like to sell it as such.
- How are you feeling? (e.g. Energetic and well. Energetic and serabut? Unpleasant and uneasy? FeelsOkayMan etc...)
Good. Giving it a shot. I'm slightly worried that I wrote my max loss today as $500, but I put this trade to be at $1000. It's worth a try. Let's get it :)
- Any distractions on your mind? (Lawan ngan gf monkaS).
Nope.

Take. BUY it very fast ... 200..21000Uptrend it's a good breakout...Bull.... Chart says all...More Than Ready To Move Ahead!

NKE zones to watchNKE is finding some short term fib and trend line support in the 146 area. We could see a push up from here but if the market weakens I would be looking at the lower 135/130 zone. It would have longer term 382 fib & trendline support as well as a gap fill. No trade planned yet as I want to watch price action first early in the week.

Bearish idea on NKE Inverse cup and handle
Used Trend Based Fib Extension through price points :
A ) 172.99
B ) 145.18
C ) 157.20
Targets are the 0.5 and 0.618 extensions accordingly.

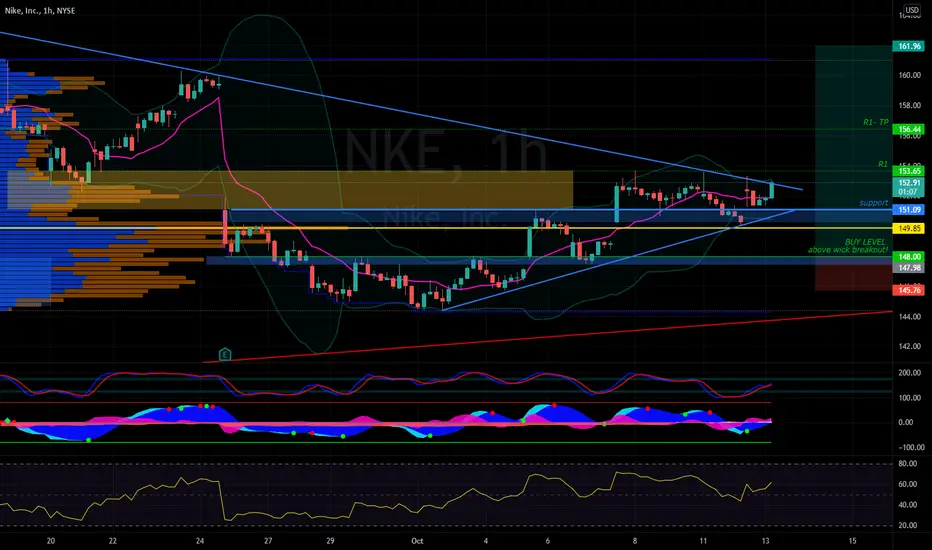
NKE long is break out of pennant and mental number of $160NKE Hourly| Broke out of cup and handle and close to completing the ER gap. Currently in a flag/pennant right now. I set my alerts above and below the flag.
Resistance is the 50D moving average which is close to mental number of $160. If we can break above $160, my fib levels above are $162.88, $167.94, and ATH of $174.38.

Set To Fall NKE is set to fall immediately, I have placed a large position to put NKE.
Technicals to look at:
Divergence+ gives a sell signal & their signals have not failed me in the past. I have been a long term customer and the profits I have made from these signals have paid for the subscription the remainder of my life. These signals are based on RSI & divergence. I am sponsored by @marketscripters so please message them for info on a low cost subscription that can help you make better trade decisions.
The MACD also shows weakening bullish divergence & growing bearish divergence
Guth 3x Confirm also has 2 very strong sell signals
My plan is to buy Puts for $155 a share Expiring 10.22.21 at the open of todays trading session and scalp a 5-75% profit based on this drop
Follow for more charts like this

Nike Inc Potential Long Hey Guys , What do you think about my analysis here on Nike
As you can see price has reached previous all time high and price has finally back retest to the support area which is from the previous breakout,
and it did also leave a small gap from the previous breakout , what we expect from there is back to fill up the gap and now it already did happen ,
what we are looking for from here is , let's wait for another bullish confirmation or a candlestick rejection such as bullish engulfing or doji to form morning star pattern for our entry position ,
there are some confluences that i stated right there for our long position,
""it might be not a good opportunity to buy long in this moment as Investor or Trader fear of the interest rate hikes and bond yields rising""
lets take the trade with your own risk !
Give me a like and comment if you like this idea !

NIKE short 📉R3 pivot respected, divergence bearish could see a drop towards trend then eventually a breakout to the downside


$NKE with a Bearish outlook following its earnings #Stocks The PEAD projected a Bearish outlook for $NKE after a Negative Under reaction following its earnings release placing the stock in drift D with an expected accuracy of 40%.
If you would like to see the Drift for another stock please message us. Also click on the Like Button if this was useful and follow us or join us.

$NKE 200D MA REVERSALNike tested the 200 D MA and attempting a reversal setting up an idea R/R setup.

Time to buyNike touching Dailey EMA 200 which is acting as a very strong support and also reached to major support, in addition Fib 0.618 is on this point.

$NKE Looking oversoldI like the idea of the 145/140P credit spread here. $1.45 credit for the 11/19 opex
30-45 days or more until expiration would capture the most premium vs. theta decay (sweet spot per Tasty Trades).
You could go long naked : ) higher risk idea . I don't have conviction on how high and quickly Nike will rebound so I like the spread trade idea here


Massive Downside on $NKEThere's a HUGE gap below $148. Looks like it will fill the gap before any bounce.
1) Gap below 148
2) Stoch curling down
3) MACD bearish
4) HUGE volume breakout

NKE Nike Price target after Head And Shoulders PatternSupply Chain issues.
Factory closes in Vietnam due to Covid-19.
Analysts are expected for the company to lower the sales guidance because of this.
Considering the head and shoulders bearish chart pattern, my price target is 140usd.

NKE Head and Shoulders FormingAs we all know NKE was forced to shut down their manufacturing facilities in Viet Nam due to the pandemic, and this represents 51% of their manufacturing capabilities in Asia. As we also know, NKE's largest customer in Asia is China, where they generate approximately 5+ Billion in revenue. It has been reported that NKE was put in the corner due to political statements made regarding China. In addition to this, it appears NKE has some type of relationship with Evergrande (through a Chinese soccer team?), where it is yet to be determined if the recent turmoil surrounding the Real Estate Empire will have an impact on the Shoe Manufacturing Empire. What does all this mean? Well, NKE appears to be forming a Head and Shoulders pattern on the Daily/1Hr where the peak of the right shoulder seems to be lining up with their earnings date. Any possible negative impact from the aforementioned factors may be amplified by a lackluster earnings report due to the supply chain issues, and could serve to complete that right shoulder. This would set us up for a potential break to the downside, and put price in the gap created during their previous earnings report.

Just Do It! NKE Longs and/or Short NKE Put SpreadPretty key support at PURPLE level.
There are four sets of support and resistance levels that are displayed by Aspen Trading’s S/R Analysis Tool. Each one is unique to a specified period of time that we then display directly on the chart. The levels are classified as follows
GREEN: displays 2 solid lines (upper/lower)
ORANGE: displays 2 lines (upper/lower)
RED: displays 2 lines (upper/lower)
PURPLE: displays 2 lines (upper/lower)
IMPORTANT: These lines will change/adjust until the end of the specified observation period is complete.
Once the observation period is complete, that range will then be displayed on the chart as a set of dotted lines that is shaded in to serve as a reference point for traders to know the key levels from the prior lookback period. This can often be very helpful.
What’s the distinction between the 4 color levels?
Essentially think of these levels on a rising scale of importance. While GREEN levels are certainly key, they do not hold the same level of significance as the PURPLE levels.
