NIKE34 trade ideas


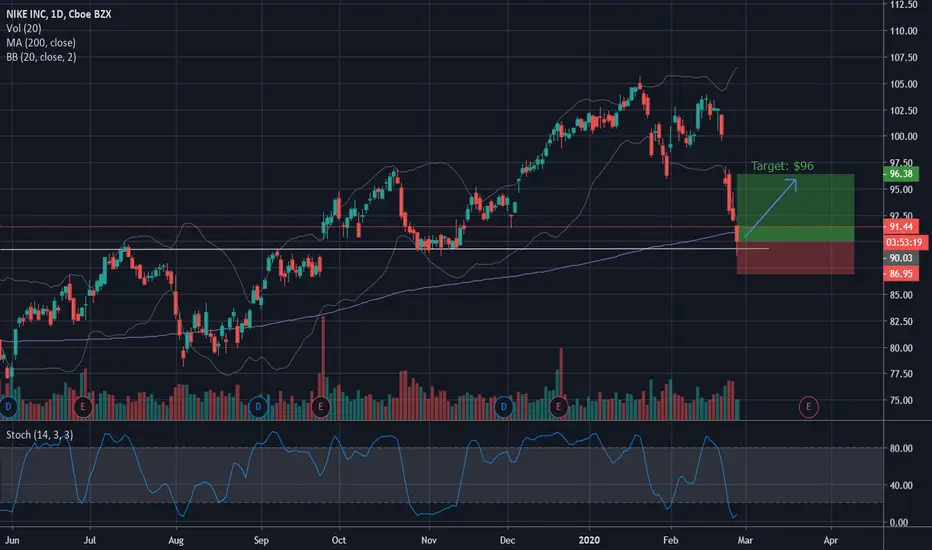
NKE Rubberband SnapbackNKE just ran into its 200 moving average along with support level of $90. The overall market is completely at an oversold state with major indexs running into 200 day moving average as well. I believe we'll see a hard bounce off these levels to minor resistance at $96
THANKS CORONAVIRUS , I CAN BUY AGAIN NIKE AT 95 !!!! SO GRATEFULBE COURAGEOUS IT WILL PASS AS ALWAYS IF YOU HAVE CASH ASIDE JUST BUY THE DIPS YOU WILL BE REWARDED IN FEW MONTHS
Take care of yourself and relax and keep calm

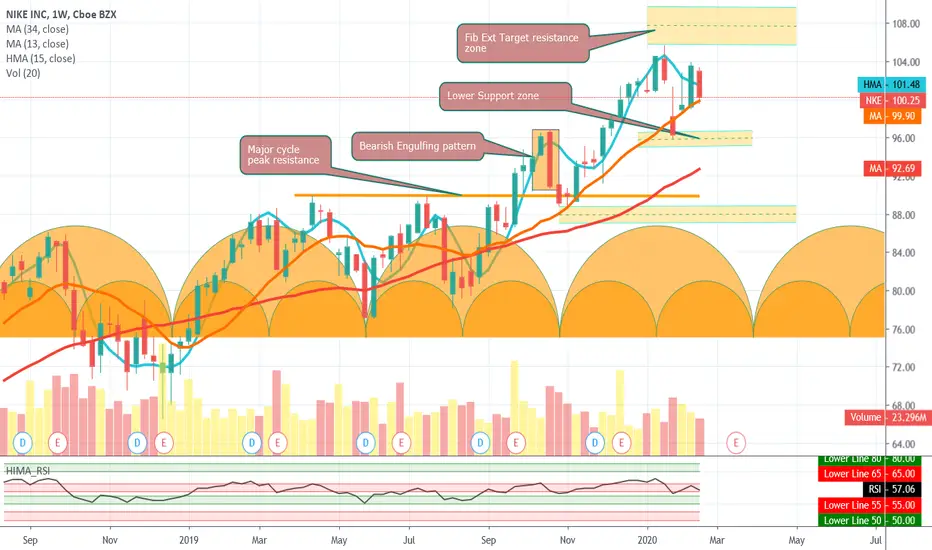
NKE - cycle bottoming - consolidation stageNow lets take a look at NKE. Weekly charts are suggesting both major and minor cycle bottoming out over the next 4 weeks. Last few cycles have bottomed in time so one may expect a timely bottom . Where we find support during this time will give us a fair idea about the next cycle expectations.
At this stage we see the following prevailing conditions:
1. $106 to 108.5 likely cycle resistance and Fib ext target zone
2. Lower support zone between $95 to 97 levels
3. $87-89 likely strong support as previous cycle peak/ support confluence zone
If you like what you see, share a thumbs up and follow for more updates
Cheers
NKE possibly turning upwards in trend channel Nike has turned down in the trend channel, approaching its mean reversal. In the event that price reaches the mean reversal and the long term RSI starts to turn upwards, I will look for a long position, with target towards upper trend channel (ATH).


Nike top forming?At least in the short-term nike seems to be forming a top at this median line & top slope in pennant. RSI hold below 70 would be indicative of a top too.


Nike Short, MACD and RSI stretched, return to 20 day MA - hedgeGetting a $100 or a $97 put in NKE would provide a nice hedge against all your other long positions as NKE trades very much in tandem with major averages and exemplifies worries like global growth/ china/ stretched evaluation

$NKE Gap fill on watch, watch for fall below wedge.Had a parabolic streak, will need a cool down. the rising wedge could break here.

Nike Awaiting FallAs you can see on my chart, I expect a fall in the Nike after overcoming the mark of $ 96. As you can see on my chart, I expect a fall on the hike, after breaking the $ 96 mark. If you want to know more information about my forecasts, subscribe to my YouTube Channel (/channel/UCFjEDgByCftksVKr8nZoOZg? View_as = subscriber) More than my forecasts for the short term

NKE in a New Range?In the trading session following the release of their Q1'20 ER on September 24, 2019, NKE closed at $90.81, finally pushing through that resistance level around $89. Although a little choppy, shares rose higher in the first half of October until Mark Parker, the 13-year CEO and 40-year employee of Nike, announced that he was stepping down on October 22, 2019. This sent NKE lower and left it hovering around that $89ish level for ~2 weeks, using this level as support.
However, since mid-November, shares have been soaring and seemingly broken through some important resistance levels. Although NKE experienced a small sell off, shares seemed to get strong support at that lower line drawn in the chart and worked its way back up to $100/share only to close just shy of that level ($99.96).
It seems that NKE has some serious room to run into the end of the year, especially considering were in the midst of the holiday season and I think we could see the shares perform very well into the start of 2020.

$NKE $100 the key level for NIKEA little selling after-hours is nothing to get concerned about, mostly by algos on a few negative words about China.
If the stock reclaims the vital psychological level of $100 and the market continues bullish it is still a buy


NIKE: Strong Resistance and Sell OpportunityThe price reached a strong resistance zone formed by the uptrend line, the upper Bollinger Band, and 100.00 round number level.
RSI reached the overbought zone, and it will be able to confirm the price reversal by a solid signal.
If you have the opportunity to sell this share, it is possible to do with entry level below the low of the 1st bearish candle and stop orders above 100.00 resistance. Profit targets should be placed based on MA with 100 and 200 periods.
Of course, all trades must be done in agreement with proper money management.

NKE long / based on NKE earning reportNKE earning report + continuation
NKE earning report - Change to bear trend

NKE - DAILY CHARTHi, today we are going to talk about Nike and its current landscape.
Nike is poised to receive increasing attention from the market as relevant events are taking place. The company reports its earnings on Thursday after the market had closed. With a strong year, this report could be a Nike event to continue its momentum, also after the company has stopped selling its products on Amazon, Nike has been able to thrive as a direct to consumer brand, which can help the company improve its performance for further quarters next year.
Thank you for reading and leave your comments if you like.
To have access to our exclusive contents, join the Traders Heaven today! Link Below.
Disclaimer: All content of Golden Dragon has only educational and informational purposes, and never should be used or take it as financial advice.


History is a guide, NKE needs to dropFrom Nike's history we see that almost all gaps get filled on this stock. Three randomly chosen shaded horizontal rectangles represent three gaps (there are many more) that all got filled eventually. Recently price action has been "sloppy" with wide gaps being made which will surely be filled sooner or later, there is also one at 84.83 which I have labeled which never got filled. Further we see that a recent Cup and Handle that has formed has almost reached it's target price in the low 98s and I will probably be shorting there unless there is strong volume supporting any move higher. Last but not least from the angled trend lines we see relatively string divergence indicating that institutional investors are more likely than not disposing of the stock. Earnings on Dec. 19th will be interesting. Please leave any comments or ask questions.
