NVDA Chart Analysis and Predictions According to my technical analysis, NVDA is on its way of retesting 100D EMA, 200D EMA and complete the head-and-shoulder pattern. This retracement is possibly stop at 127-130. Once the retest is complete, further correction will follow. I marked the possible gaps that needs to be filled, the nearest gap first. However, depending on the macro market environment and NVDA's performance, not all the gaps have to be filled.
NVDC34 trade ideas

NVDA Breakdown: Is a Trend Reversal Unfolding?NVDA is showing signs of weakness, with an A-B-C correction potentially unfolding, hinting at a trend reversal. The near-term peak in AI compute demand, proven by DeepSeek , and NVDA’s reliance on Taiwan-based TSMC amid geopolitical risks add fundamental pressure. Broader market sentiment hasn’t turned fully bearish yet either, with CPCE unchanged for March — suggesting market participants haven't fully priced in further downside.

Chart Study #2 Mixed IndicatorsMy focus is on the mix of Indicators on this these charts: IBM and SMCI because I need to have the ability to see how much resistance is overhead, which warns me if the trade will be easier, or more of a struggle. I like easy.
The Indicators here are:
VRVP
4 EMAs
EM VRVP
FVG
FVG Instantaneous Mitigation
Gann Square of 9
Previous N Days/Weeks/Months High Low
TwV MTF Dynamic VRVP
Future Trend Channel [ChartPrime}
I like this setup a lot, it seems sensible for many reasons, but I don't see yet how I can figure out if the overhead is clearer or more stuffed-up.

NVDA eyes on $113.56: Golden Genesis fib and critical supportWatching $113.56 Golden Genesis fib for critical support.
Reinforced by $111.63 Covid fib for a strong support zone.
Bulls must hold this zone at all costs or it could really ugly.
Previous Analysis that called the TOP
.

NVDA Lost it's key support level. Are we headed to 50$ ?The critical support level has been breached, and the price action suggests we could be headed toward the $50 zone 📉. Adding fuel to the bearish case, we see a major bearish divergence on the MFI indicator, signaling weakening momentum.
Is this the beginning of a deeper correction? Stay sharp! ⚠️

NVDA... Gann Box Stacking like my GPUs for LLMsBasically some interesting levels that have been hit or about to, again with Log enabled or not, which are activated by clicking on the Gann box angle setting...neat.
Anywho, for those not able to view in better:
no log daily close
daily close log:

nvidia downward wedge bullish trendA downward wedge bullish trend forms after a downtrend, signaling a potential reversal to the upside.

NVDA: Will This Reversal Zone Hold or Collapse? Key Levels to Wa📊 Market Structure & Trend Analysis
* NVDA is trading within a descending channel, with lower highs and lower lows defining the structure.
* The price has entered a key reversal zone but remains below the resistance trendline.
* A potential breakout above $110 could signal a shift in momentum.
📍 Support & Resistance Levels
* Resistance Levels:
* $110 – Short-term resistance, within the rejection zone.
* $126-$130 – Major CALL resistance zone, confirmed by GEX data.
* $134.94 – Highest resistance from previous structure.
* Support Levels:
* $105 – Immediate support, aligning with high negative GEX (PUT Wall).
* $100 – Psychological support level.
* $95-$90 – Deep support zone, if NVDA fails to hold current levels.
🌀 GEX & Options Data Insights
* 📊 Call Resistance at $130-$135: Strong gamma resistance could limit upside.
* 🔻 Negative GEX at $105: This suggests a high concentration of PUTs, making it a potential support zone.
* 📈 Implied Volatility (IV):
* IV Rank: 51.6 (Moderate)
* IVx Avg: 72.3 (Currently low, meaning options are relatively cheaper)
* Call Activity: 14.7%, indicating weak bullish participation.
* 🔺 Bullish Breakout Target: If NVDA moves above $110, potential upside towards $126-$130.
* 🔻 Bearish Breakdown Target: If NVDA fails to hold $105, it may test $100 or lower.
🎯 Trade Setups
🔵 Bullish Scenario (Breakout Above $110)
* Entry: Above $110 with volume confirmation.
* Targets: $126, $130.
* Stop-Loss: Below $105.
🔴 Bearish Scenario (Rejection at $110)
* Entry: Below $109 after confirmation.
* Targets: $105, $100.
* Stop-Loss: Above $112.
⚠️ Final Thoughts & Risk Management
* NVDA is at a critical juncture – a breakout could push it toward higher resistance zones, but failure here may lead to a retest of $100.
* Monitor volume and momentum indicators (MACD, RSI) for confirmation.
* Options flow suggests a weak bullish push, so careful position sizing is key.
📌 Disclaimer: This analysis is for educational purposes only. Always do your own research and manage risk appropriately. 🚀

NVDIANVIDIA Corporation (ticker: NVDA) is a leading technology company specializing in graphics processing units (GPUs) and artificial intelligence (AI) solutions. As of March 11, 2025, NVIDIA’s stock is trading at $110.74, reflecting a 3.76% increase from the previous close.
Recently, NVIDIA’s stock has experienced notable fluctuations. On March 10, 2025, the stock declined by 5.1% to $106.98, marking its lowest close since September 9, 2024. This downturn contributed to a 20% loss year-to-date, influenced by concerns over potential tariffs and their impact on AI chip demand. 
Despite these challenges, analysts remain optimistic about NVIDIA’s long-term prospects. Melius Research analyst Ben Reitzes maintained a ‘Buy’ rating on the stock, adjusting the two-year price target to $170 from $195, citing uncertainties such as potential tariffs and regulatory changes.  Additionally, Wedbush analysts anticipate that AI leaders like NVIDIA will reach record highs in the latter half of 2025, driven by the continued growth and adoption of AI technologies. 
Investors should monitor upcoming events, such as NVIDIA’s GPU Technology Conference, where the company is expected to unveil advancements in AI and GPU innovations. These developments could provide insights into NVIDIA’s strategic direction and potential market performance. 
Given the inherent volatility in the semiconductor industry, diversifying investments across multiple companies may help mitigate risks associated with single-stock holdings like NVIDIA. 

NVDA +$130 BY END OF MARCH! NVIDIA (NVDA) is currently trading at $112.69, and several recent developments suggest a potential surge beyond $130 by the end of March 2025.
NVIDIA's Blackwell architecture, introduced in March 2024, has seen unprecedented demand. Reports indicate that the entire 2025 production of Blackwell silicon is already sold out, underscoring NVIDIA's leadership in AI technology and positioning the company for substantial revenue growth.
NVIDIA's stock has experienced a significant selloff, dropping 8.7% recently and 15% since the beginning of the year, making it an appealing investment opportunity. The stock's valuation has decreased to a slight premium over the S&P 500 and is at its lowest premium since 2016. NVIDIA's stock is trading below parity versus the PHLX Semiconductor Index, a rare occurrence in the past decade, and 25 times forward earnings, a near decade low. Historically, investors have benefited from buying the stock at this multiple.
Considering these factors, NVIDIA's stock appears well-positioned to exceed $130 by the end of March 2025, offering investors a promising opportunity to capitalize on the company's innovative advancements and strategic market positioning.

Taking Advantage of NVDA’s Pullback: Strategic Entry PointsMarket corrections often create the best opportunities, and NVDA’s recent pullback is no exception. For those looking to step in at key levels, here are three well-placed entry points:
106.7 – A strong support zone where buying pressure may start to build, signaling a potential bounce.
96 – A deeper correction level, offering an even better risk-reward ratio as the stock finds stability.
81 – A significant support area, where the price could reach a bottom before a strong reversal.
For profit targets, consider:
123 – The first checkpoint, locking in gains as the price starts recovering.
138 – A critical level where momentum could face resistance but also confirm a strong uptrend.
150 – A high-probability target if the market fully recovers, offering a substantial upside from lower entries.
While corrections can seem risky, they also open doors for calculated entries and strategic positioning. Always manage risk wisely and adjust stops accordingly.
Disclaimer: This analysis is for informational purposes only and does not constitute investment advice. Trading involves risks, and you should conduct your own research or consult with a financial advisor before making any investment decisions.

From Boom to Bust? Nvidia Warns of a Potential 50% DropAfter an incredible rally, Nvidia NASDAQ:NVDA has finally hit a wall at its all−time high of $140, failing to secure a strong monthly close above this critical resistance level. This stagnation at the peak is a red flag for the stock’s near-term momentum.
Since the rally began in 2016, the monthly chart has been overwhelmingly bullish, with only a few exceptions: 2018, 2022, and now 2024, where the monthly chart has printed a bearish engulfing candle. Historically, when this pattern has appeared, it has led to steep retraces. Based on the median pullback from the past two occurrences, we could see a 50% decline by mid 2025 from current levels, a potential bloodbath for unprepared investors.
Is this a guaranteed outcome? Of course not. But higher timeframes carry significant weight in macro price action, and this bearish signal is too significant to ignore. Stay alert—volatility ahead!
While a short-term pump toward the $140s is more than likely, it’s important to recognize that this move will feel more like a dead cat bounce than a sustainable recovery. For those considering a short position, this potential bounce could offer the perfect entry point.
However, unless NVDA can achieve a strong break above $150 and successfully flip this level into support, there’s no compelling reason to turn bullish here. The macro warning signs remain intact, and the risk of a deeper retrace increases.

NVIDIA POSSIBLE SELLThe market is currently testing the current Weekly area.
Based on Daily AND 4HR TF, the market seems to be forming a possible reversal pattern which could lead to a possible SELLING OPPORTUNITY.
We could see SELLERS coming in strong should the current level hold.
Disclaimer:
Please be advised that the information presented on TradingView is solely intended for educational and informational purposes only.The analysis provided is based on my own view of the market. Please be reminded that you are solely responsible for the trading decisions on your account.
High-Risk Warning
Trading in foreign exchange on margin entails high risk and is not suitable for all investors. Past performance does not guarantee future results. In this case, the high degree of leverage can act both against you and in your favor.

NVIDIA - the recession has just began?Well it is my theory based in a few indicators that we are in a small recession which just has started and will continue for several weeks to months. And will the bring whole market even further down. And this time the American market will be punished while the European market will be a buy for me. So I corrected my Nvidia analysis its not anymore a small retracement for me but a large retracement which will bring some great buying opportunities but later.

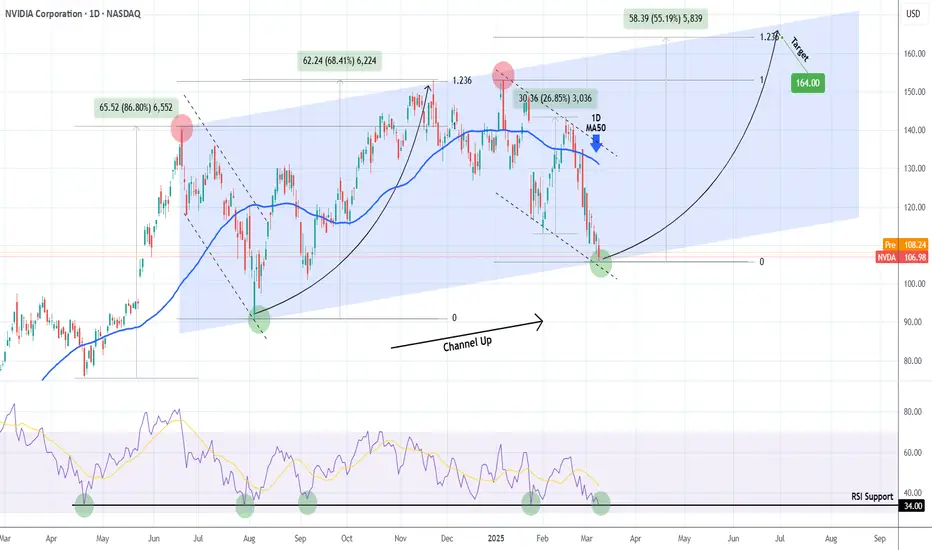
NVIDIA 9-month Channel Up bottomed! Is it a buy??NVIDIA Corporation (NVDA) has been trading within a Channel Up pattern for almost 9 months (since the June 20 2024 High). The correction since the start of January is technically the pattern's Bearish Leg and yesterday it hit the bottom (Higher Low trend-line).
Last time it did so was on August 05 2024 and an instant rebound followed. That was also the time the 1D RSI was on the 34.00 Support, just like today. In fact every time in the past 11 months that this RSI Support was tested, the price rebounded aggressively by at least +26.85%.
Since the previous Higher High rebound peaked on the 1.236 Fibonacci extension, our Target on the medium-term will be $164.00.
-------------------------------------------------------------------------------
** Please LIKE 👍, FOLLOW ✅, SHARE 🙌 and COMMENT ✍ if you enjoy this idea! Also share your ideas and charts in the comments section below! This is best way to keep it relevant, support us, keep the content here free and allow the idea to reach as many people as possible. **
-------------------------------------------------------------------------------
💸💸💸💸💸💸
👇 👇 👇 👇 👇 👇
Nvidia Investing opportunity (short-term) 1I expect Nvidia share to hit $175+- in a year
I think people over-estimate the effect of China being cut off, its likely going to be less than a 10% revenue drop, and it seems with the Stargate project that the gap can maybe be filled.
There's other things to consider, if the USA was struggling with "job shortages" currently and the Trump Administration's goal is to increase internal production/reliance for goods and services and also potentially other new partners (like Russia/Ukraine) then won't the demand for AI actually just become even greater if China starts getting cut off more?
You have to also consider the strong stance against illegal immigrants here, so cheaper labor goes away, so what drones on farms, AI????
I think the target is China, I think the aggressive stance against EU and Canada might be limited in magnitude, the real target is China, this is all some grand plan to try and remove them from the stage or weaken their position.
let's say the deal flies with the mineral rights in Ukraine and/or Russia, it will reduce reliance on China.
I think Russia is desperate for a deal that can boost its economy, I think its very serious about partnering up with the USA, at least in a more indirect way.
I think both the USA and Russia knows, the age of oil has passed its peak. If you look at it long-term wise, a direct conflict of interest regarding oil supply etc. can at this point perhaps decline, maybe?
You need to consider the Northern Sea Trade route as well, won't that theoretically make trade between the USA and Russia easier and more "relevant" as the ice melts.
I think big changes are on the way, what really scares the market is uncertainty and short-term negative consequences of any big change.
I think AI is going to become more relevant, and the stage is being setup for increased demand in AI, I think the market does over-react, and it might continue to go down, but how much?
Nvidia share value has shred 33.33% now, a third, how much more, 50%, but then at 50% you think perhaps its now gone too far, but even then the upside looks way bigger.
I think a phased approach could be better, I think that phased approach starts now, Nvidia at $100 a share, and maybe then more later on if it drops further to $75 etc.
BUT this is all just an opinion, I am no professional, perhaps a serious hobbyist investor/long-term trading, my real money I have made from longer-term trading positions to short-term investing (1+ year hold shares, and bonds), the reason I am in net negative still (last 2 years it was net positive) is because of shorter-term trading, end of story, so I will never do short-term trading again.
that linear regression I took from when OpenAI released around 2022 July, according to the linear regression channel its likely to perhaps revert to the mean (go back up).
I know that the Microsoft Bubble happened somewhat similarly in the far past, there was the initial boom of 3-4 years then it struggled for months to a year, like Nvidia is doing now, and it went down somewhat, but then the boom continued and continued, if we get something like that with Nvidia, even 50% of that, I wouldn't worry about Nvidia shares hitting $175.
I think it can go lower than $75 potentially, and I will buy again when it gets there but I feel like I can hold this share regardless, maybe we don't see $175 in the next year, but $125 maybe, even that is good enough.
I am risking $5000+- dollars in a Long Position, I am holding indefinitely, I bought at $106
I will have the same amount of money ready if it drops let's say in a few months or so to $75+- then I buy again, but I start buying now.
I might be a bit too early, the SP500 is down 10%+- from 6150, I don't think you should all in now, but you can "start" to consider buying now.

NVIDIA: Megaphone bottomed. Rally to $195 starting.NVIDIA is almost oversold on its 1D technical outlook (RSI = 34.183, MACD = -6.220, ADX = 39.717) as it reach the bottom (LL) trendline of the Megaphone pattern that it has been trading in since November 21st 2024. This is not the first time we see NVDA inside such Megaphone pattern. As a matter of fact, it was during July-October 2023 when it last did so. The 3rd LL was the buy signal and it coincided with a Triple Bottom on the 1D RSI. This is the exact position we are at right now. The stock has completed three lows below the 1D MA50 and looks ready to rebound with force. The smallest recent rally has been +86.41%. The trade is long, TP = 195.00.
## If you like our free content follow our profile to get more daily ideas. ##
## Comments and likes are greatly appreciated. ##

NVDA, Long, 2H✅ NVDA rejected the key support at 109.60 and formed a bullish RSI divergence, indicating a potential upward move. The price is expected to rise from this level.
LONG 🚀
✅ Like and subscribe to never miss a new analysis! ✅

NVDA $90 PRISONAs last time we were stuck within the $90 range I can see a previous order block that was created and retested making it invalid. I am considering regardless this area of $91/94 as a good demand area. Not only the sentiment of the fanatics is that it is a discounted price at $90. But speculations are already running online that once they reach this area, they need to load up to head to $130.
This is a good sentiment to capitalize both on the movement down and the bounce.
The good traders do not become "fans" of a company. We just capitalize on fanatic sentiments to get their money as any good record label would with their artist.
Ladies and gentlemen, NVDA is our artist for this week concert.
Let us capitalize on the fans and hope they request an encore.

Massive inverted cup and handle 4hr shows massive inverted cup and handle looks complete and ready for the drop. Be cautious and again this based off my opinion and analysis.

Nvidia is in BIG TROUBLE! Find out WHY!Nvidia is in BIG TROUBLE! Find out WHY!
NASDAQ:NVDA has been a rocket ship to the upside for over 2 years now but all rocket ships eventually run out of fuel.
Check out what I'm seeing on the charts and where Nvidia is going next!
Not financial advice

Ohhh no Inverted cup handleIf look at the 1hr chart you will see a massive inverted cup and handle. I strongly believe the handle is complete or will be completed earlier this week. We could see 102-105 this week. Again this is my opinion based off the market and current trends.

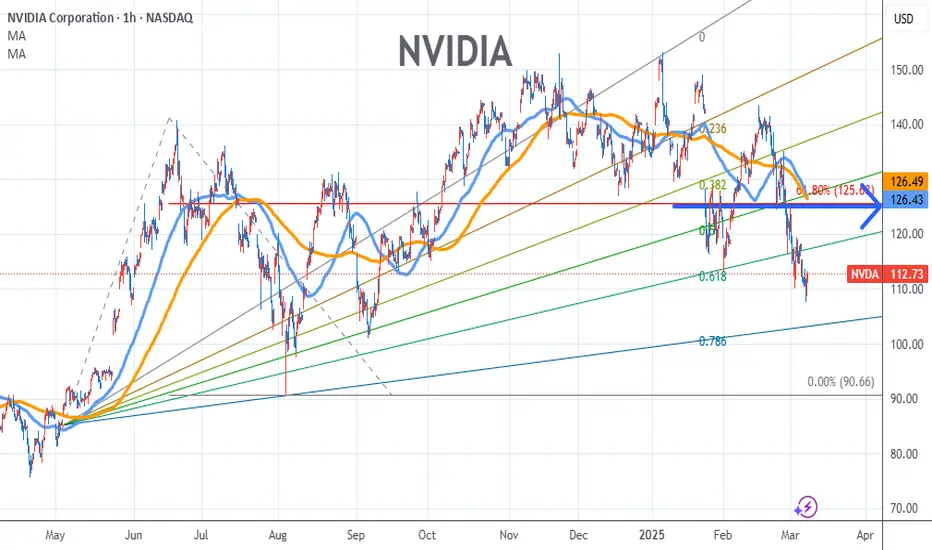
NVIDIA Stock Chart Fibonacci Analysys 030825 Trading Idea
1) Find a FIBO slingshot
2) Check FIBO 61.80% level
3) Entry Point > 126/61.80%
Chart time frame: B
A) 15 min(1W-3M)
B) 1 hr(3M-6M)
C) 4 hr(6M-1year)
D) 1 day(1-3years)
Stock progress: B
A) Keep rising over 61.80% resistance
B) 61.80% resistance
C) 61.80% support
D) Hit the bottom
E) Hit the top
Stocks rise as they rise from support and fall from resistance. Our goal is to find a low support point and enter. It can be referred to as buying at the pullback point. The pullback point can be found with a Fibonacci extension of 61.80%. This is a step to find entry level. 1) Find a triangle (Fibonacci Speed Fan Line) that connects the high (resistance) and low (support) points of the stock in progress, where it is continuously expressed as a Slingshot, 2) and create a Fibonacci extension level for the first rising wave from the start point of slingshot pattern.
When the current price goes over 61.80% level , that can be a good entry point, especially if the SMA 100 and 200 curves are gathered together at 61.80%, it is a very good entry point.
As a great help, tradingview provides these Fibonacci speed fan lines and extension levels with ease. So if you use the Fibonacci fan line, the extension level, and the SMA 100/200 curve well, you can find an entry point for the stock market. At least you have to enter at this low point to avoid trading failure, and if you are skilled at entering this low point, with fibonacci6180 technique, your reading skill to chart will be greatly improved.
If you want to do day trading, please set the time frame to 5 minutes or 15 minutes, and you will see many of the low point of rising stocks.
If want to prefer long term range trading, you can set the time frame to 1 hr or 1 day.