Brazilian Petro This is It Time for the Crash! PETR4Hello followers,
if you follow PETROBRAS - BRAZILIAN PETRO - PETR4
this is the time to take profit, it is time for the crash.
good luck and good profit.
MW
PETR4 trade ideas

$PBR ~ Correction in progress...As shown, majority of energy stocks are starting to correct. Looking into the future, we believe these companies will provide amazing opportunities. We expect barrels of oil to reach $300-400 a barrel by the end of the decade. Recommend tracking this sector very closely for amazing opportunities.


$PBR.A with a Neutral outlook following its earnings #Stocks The PEAD projected a Neutral outlook for $PBR.A after a Negative over reaction following its earnings release placing the stock in drift C with an expected accuracy of 77.78%.

loving the cluster support bounce here :)PBR attempting to break past trend resistance after a nice bounce off cluster support!
targeting 15.26-16.52-17.78, below 12.66 we see a lot more downside

Long scalp $PBRBased on it's uptrend, rebound from support and a familiar chart pattern confirmed by my technical indicators, I expect at least half a percent of profits IF $PBR exceeds today's high of $13.39 during tomorrow's session.

PBR Long biasThis is a 5 bagger trade, without going into too much depth...
books strong, div yield; 18.52%, do your own dd but this thing will rocket with supply issues for oil, nat gas, and etcccc

$PBR.A with a Bullish outlook following its earnings #Stocks The PEAD projected a Bullish outlook for $PBR.A after a Positive over reaction following its earnings release placing the stock in drift B with an expected accuracy of 71.43%.

$PBR with a Bullish outlook following its earnings #Stocks The PEAD projected a Bullish outlook for $PBR after a Negative Under reaction following its earnings release placing the stock in drift D with an expected accuracy of 83.33%.


Alta da PETR4?Analisando últimas variações do gráfico de candle diário.
Aprendendo a analisar gráficos...

Petrobras. Chasing oil prices.Petrobras (Petroleo Brasileiro) is the largest Brazilian oil and gas company. The company is in the top 20 largest oil and gas companies in the world by capitalization with a value of $69.9B. Petrobras also ranks 7th in terms of oil production, producing almost 2 million barrels per day (Saudi Aramco produces 10.9 million and ranks 1st).
➡️ On the daily chart, the rise after March 2020 forms zigzags, suggesting that this move represents the start of an initial diagonal. In the second half of the past year, the price consolidated above the broken level of $9.3 - $9.6 , forming a triangle presumably in the {b}of3 wave of the diagonal.
➡️ On the hourly chart, stock is growing along with oil prices, moving within the wave (iii)of{c}of3. This suggests a slight correction after a sharp growth of almost 20% over the past 10 days.
📈 The estimated goal of the movement is the level at which the shares were traded before the start of the COVID - $14.5 - $15 per share. As well as the local maximum of 2019, which the price tested as many as 5 times – $17 .
➖ Local levels, where my wave interpretation should be revised are $10.7 , $9.2 and $7 .

The PBR is out of its bearish channelEverything is clear in the picture.
The downward channel that has been broken upwards and today's red candle can be considered as a pullback.
The Brazilian Stock Exchange index may drop about five percent after this and then move up, so it can put this share under a bit of pressure, but overall my opinion is bullish in the medium term. Oil prices have risen dramatically and for the next two months there is no news of Iran's return to the JCPOA and the oil market (away from sanctions) and it seems that the sentiment is positive for now.
The company's report next week is also very important, so please review any transaction by yourself.
That was just my opinion and there is no certainty
I'll be happy to share your opinions with me.

$PBR BREAKOUT ALERT we should hold our support above the 11.87$ to confirm the break out, make sure to take profit on the way.

PBR going out of the bullish flag + Wyckoff LPS and test. 07.12.2021
NYSE:PBR
GFS 70,69
with the bullish flag formation, which the price exited already, there's a good chance of the price going higher if it brakes the $11.14 point.
Often a bullish flag suggests Wyckoff reaccumulation, which is evident here, with the price reaching the 'TEST' in the last phase last week. I'm keeping my eyes for longs this or next week with PBR.

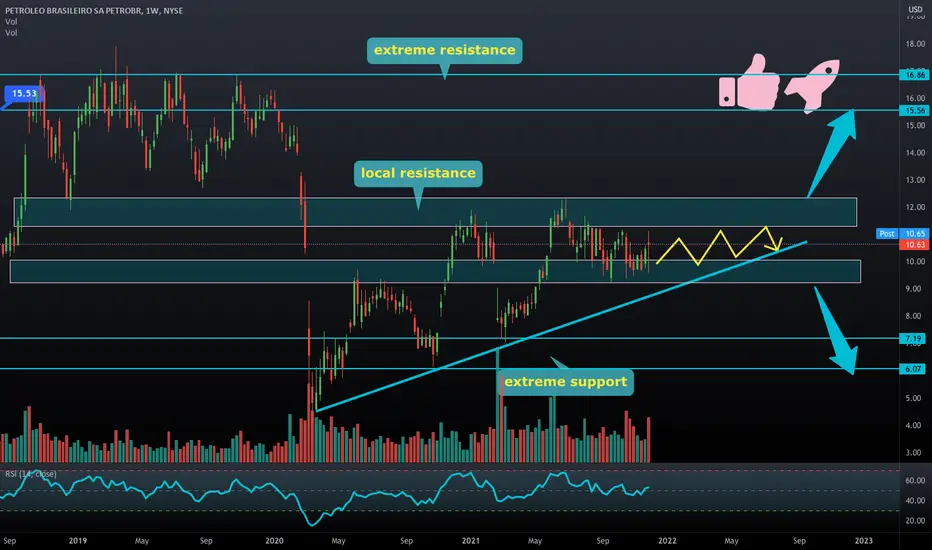
consolidation mode active 💯PBR has been stuck in consolidation for half a year now, and like I said many times before consolidation can last a few weeks or a few years.
with these plays its important to wait for a confirmation of a breakout past a certain resistance zone.
in PBR's case over 12.4 we can target 15.56 and 16.86! under 9.15 we can target 7.19 and 6.07. for now I am neutral
goodluck traders, like and follow for more! 💘
PBR 4 Hr ChartPBR could hold great risk vs. reward on ATM options. I think the spring is wound tight and is ready to give, I'm just betting to the up side.

Petroleo Brasiliero up for a move up. PBRLast time when I analyzed this stock, we seen a move to the downside, confirming a zigzag as one of the potential patterns in this particular case. A bit of time has passed since then and it seems that we have clearly begun on the first instances of that coveted Wave C. We are bullish in a generally, currently bearish stock.
We are not in the business of getting every prediction right, no one ever does and that is not the aim of the game. The Fibonacci targets are highlighted in green with invalidation in red. Fibonacci goals, it is prudent to suggest, are nothing more than mere fractally evident and therefore statistically likely levels that the market will go to. Having said that, the market will always do what it wants and always has a mind of its own. Therefore, none of this is financial advice, so do your own research and rely only on your own analysis. Trading is a true one man sport. Good luck out there and stay safe!

PBR WeeklyBroader perspective with the weekly chart. The market makers could be holding the support line into earnings.

PBR DailyNice price for the energy play. 14 million pop in todays volume would suggest someones holding the support in place.

Petrobras Attempts a BreakoutEmerging markets have mostly struggled lately as the U.S. dollar climbed. That may have created an opportunity in Brazilian energy driller Petrobras.
Unlike other oil giants like Exxon Mobil and Chevron , PBR has barely moved in the last month as crude oil jumped. However, it closed above its 50-day simple moving average (SMA) on Friday and is continuing to fight higher today.
The next pattern is the downward-sloping trendline along the peaks of July and August, which prices are also trying to break.
Third, consider the area where PBR has bounced. It’s not only near the “nice round number” of $10, but is also close to the 200-day SMA. That kind of support from below could also help drive a potential breakout through the falling trendline.
Finally, the shorter-term trend is potentially bullish after the 8-day exponential moving average (EMA) crossed above the 21-day EMA on Friday.
TradeStation is a pioneer in the trading industry, providing access to stocks, options, futures and cryptocurrencies. See our Overview for more.

PBRLONG-TERM: Broke out of a wedge, broke back over 200 MA, classic bullish divergence on the daily. (not financial advice)

