Pfizer Flag and pole Target AchievedHello ,
I had previously published a Flag and Pole pattern on Pfizer Inc. ( See my previous ideas on PFE )
Just as a confirmation about the nature of technical analysis, today the target is achieved.
Please feel free to leave your feedback and a like.
Follow for more technical analysis.
No subscription, No fees. All Free.
Thank You
PFIZ34 trade ideas


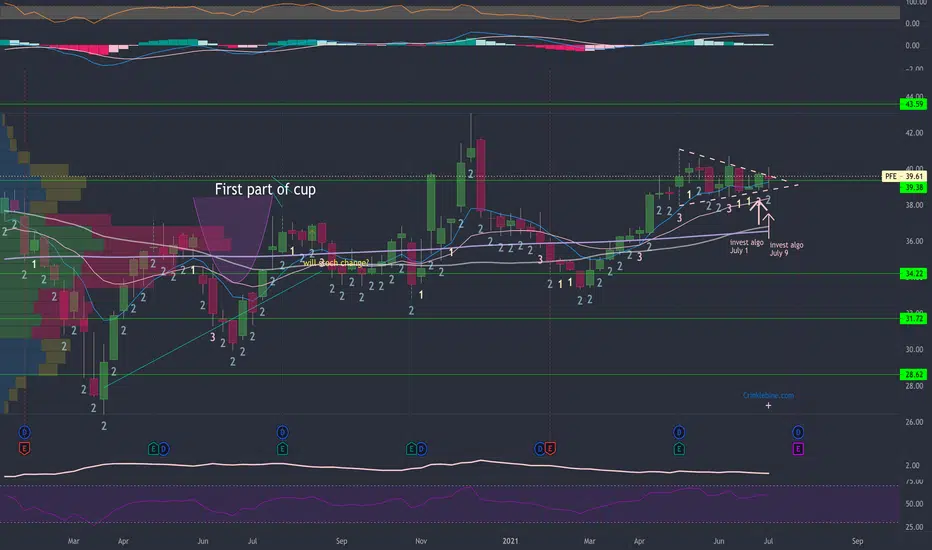
PFE BreakoutNice cup and handle formation, anticipated stronger than forecasted earning to come Jul 28th. Presume we will catch some cross winds from Moderna's momentum. Setting a target price of $50 / share and would love to hear your thoughts!


How to find a breakout?!Some additional info:
The broader market is a key player in this game. It needs to be bullish!!
MACD needs to show some momentum and RSI shouldn't be overbought.
At last but not least, pay attention to the volume as well. Big green candle with low volume isn't that bullish at all.

PFE Pfizer short term Price TargetWith the new Covid-19 Delta Variant which is more contagious than the other virus strains the question is if you want to get vaccinated or get COVID-19.
PFE Pfizer has a great vaccine, a decent P/E Ratio (TTM) of 20.34, pays Forward Dividend & Yield of 1.56 (3.89%) and it is not at all time high like MRNA for example.
Expected sales from vaccine in 2021: $15bn-$30bn
My short term price target is 44usd.
i`m looking forward to read your opinion about it.

PFE looking bullishWeekly breakout, monthly breakout. Weekly buy signal. Earnings might be all this stock needs to fully break out. Looking at Aug 20th $42 calls

$PFE Swing Play Trading StrategyBeautiful Cup & Handle forming (C&H) on the 1D timeframe
Entry point is $39 (key support)
Exit is $42-43
$PFE 8/6 $41c (0.42)


PFIZER FLAG AND POLE DAILY TIME FRAME .. PFIZER GIVING A CLASSIC FLAG AND POLE PATTERN.
8% UPSIDE WITH AN AGGRESSIVE TARGET
FEEL FREE TO PROVIDE FEEDBACK
THANKS

Pfizer Will move higher.Price has been consolidating for quite sometime now in a Bullish Triangle.
Possible target: 43.00
What your thought about this simple analysis? Do well to write about it in the comment section.
Give this a Like and follow! Thanks

$PFE - still like it I liked it last week and I like it this week. I am holding options on this.
The worst part of the chart is that it is at resistance. If it can use the pennant to break up, it will pan out nicely I think.


PFE D1Pfizer shares showed a good upward trend when vaccinations began. Because their vaccine has been recognized as one of the most effective. The company entered into expensive contracts, which became a good incentive for the growth of shares. Today the media are talking about a new Covid stamp. Vaccines have not yet been upgraded, therefore, in this situation, the Pfizer vaccine will also be one of the leading. That will give an opportunity to continue the growth of shares.

PFE D1Pfizer shares showed a good upward trend when vaccinations began. Because their vaccine has been recognized as one of the most effective. The company entered into expensive contracts, which became a good incentive for the growth of shares. Today the media are talking about a new Covid stamp. Vaccines have not yet been upgraded, therefore, in this situation, the Pfizer vaccine will also be one of the leading. That will give an opportunity to continue the growth of shares.

PFE trading ideaMy analysis on Pfizer (PFE) on 29.06.2021 5:08 AM. I am expecting a drop to the support and then bounce back to the resistance.


Stocks - Pfizer DistributionSpeculation for PFE:
- Comirnaty news July 13, 2021.
- Confluence with Vanna hedging downside on indices with SKEW at ATH.
GLHF
- DPT

Wait for Pattern to breakI am nervous on this stock. Fundamental of this stock is strong. But technical analysis it looks bearish to me. On 1 week chart rsi is making lower high. Also it seems in next few days it will go down. Will see how much it goes down.
Its best wait for pattern to break.

Buy on Break-Out - PFE [S] 23 June 2021PFE
Reversal detected after bouncing off support at 38.70
Broke downwards trend on 21/6/2021. Bounced off the long-term bullish trend line.
Showing recovery strength with Green candle and 1st Green Heikin-Ashi on 22/6/2021.
Look for bullish confirmation if 3 White Soldiers on 23/6.
Price action is still moving along the long term bullish trend. Will show strength if 40-ish resistance zone can be broken.
Based on Swing and ATR, Stop Loss can be at 38.04
First Take Profit target at 40.58 (Fib 78.6%), second TP target at 42.77 (Fib 161.8%)
Trend
Monthly: Uptrend
Weekly: Uptrend
Daily: Uptrend
Volume: Decreasing (Diverging againt increasing price)
SMA: Bullish , Showing strength as 50MA is moving away from 200MA
Slow Stochastics: Bullish Crossover on 22 June
RSI: Showing slight uptrend
Wait for good breakout and confirmation at final trading hour
TF1D Break-out at 39.84
TF1H Confirmation: Green Candle
Rating m w d 4h h: SB B B B B
