$PFE wedge $PFE - Positive news incoming and stock has been beaten down. Broke out of wedge while i was out.
PFIZ34 trade ideas


PFIZER DAILY ANALYSISHi friends
the daily chart of this market shows with a strong probability of a downward trend in the coming days but we must at the same time be vigilant of reversal of this market towards the opposite direction
please subscribe for more information

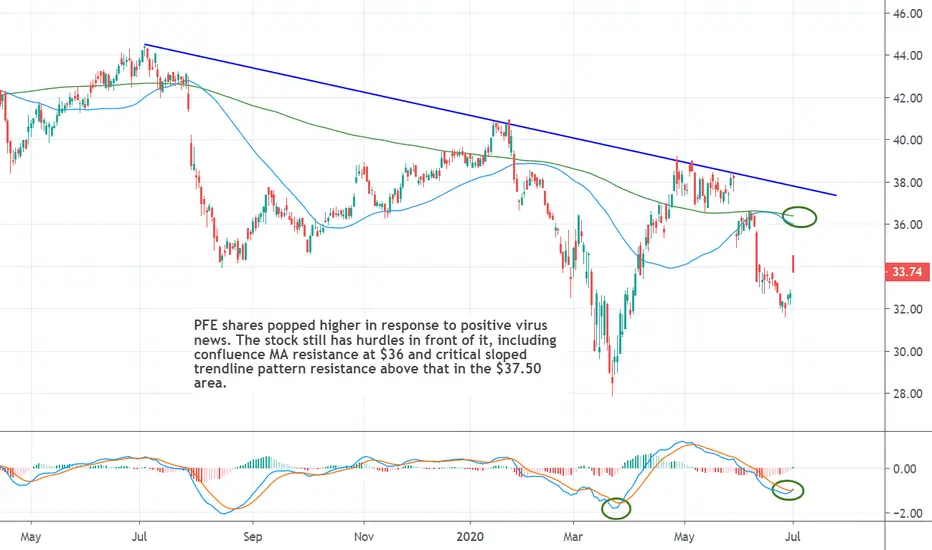
$PFE Rips on Vaccine New, but has Hurdles AbovePFE shares popped higher in response to positive virus news.
The stock still has hurdles in front of it, including confluence MA resistance at $36 and critical sloped trendline pattern resistance above that in the $37.50 area.
FDA Approves BAVENCIO as First-Line Maintenance Treatment for PaPFE: Pfizer Inc.
2020-06-30 19:30:00
FDA Approves BAVENCIO as First-Line Maintenance Treatment for Patients with Locally Advanced or Metastatic Urothelial Carcinoma
@PFE - BUY based on CCI 20 Close (-76.91)BUY ONLY FOR THIS ONE...
@PFE
ESTIMATED EPS USD 0.69 - WILL BE UPDATED ON 28 JUL 2020
LAST EPS USD 0.38
LAST DIVIDEND USD 0.61

Outlook PFE / Pfizerdue to some open gaps I see some more potential in Pfizer, especially now after some successful results in their tests for a COVID-19 antidote.

Pfizer: Strong Sell Opportunity.PFE continues to underperform on the long-term and under the recent fundamentals the pressure on it is growing. The Bearish Megaphone on 1D (RSI = 33.977, MACD = -1.120, ADX = 56.370) has printed a bearish continuation sequence that extends at least towards the 27.90 Support.
** If you like our free content follow our profile to get more daily ideas. **
Comments and likes are greatly appreciated.

@PFE - BUY based on CCI 20 Close (-111.14)Buy Only for this One...
@PFE
Estimated EPS USD 0.69
Last EPS USD 0.61
Last Dividend USD 0.38

@PFE - BUY based on CCI 20 Close (-97.02)Buy Only for this One...
@PFE
Estimated Earning per Share USD 0.69
Last EPS USD 0.61
Last Dividend USD 0.38

pfizeri tnhimk we wait bullish price if you see the type candle thats means we wit uptrend until 33.34

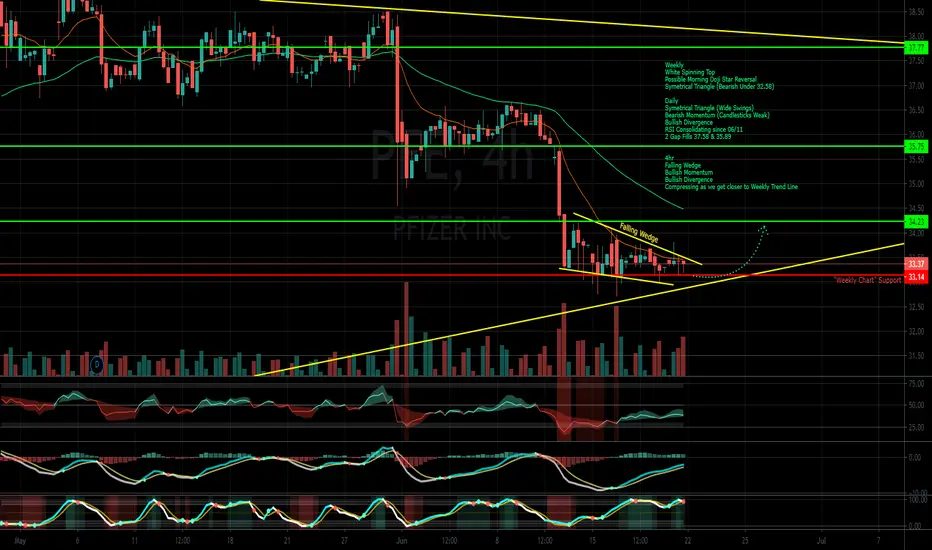
PFE Analysis Weekly Chart
White Spinning Top
Possible Morning Doji Star Reversal
Symmetrical Triangle (Bearish Under 32.58)
Daily Chart
Symmetrical Triangle (Wide Swings)
Bearish Momentum (Candlesticks Weak)
Bullish Divergence
RSI Consolidating since 06/11
2 Gap Fills 37.58 & 35.89
4hr Chart
Falling Wedge
Bullish Momentum
Bullish Divergence
Compressing as we get closer to Weekly Trend Line
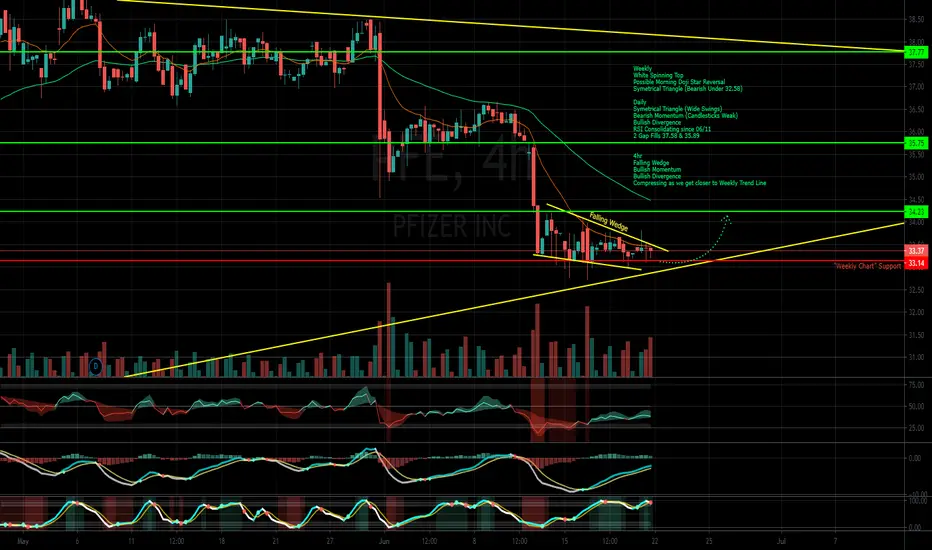
LONG // PFE // US STOCKSTrade Safe! Don`t be greedy!
Take care and place small trades! If necessary, I will place more long trades at this asset! All new information or recommendations I will post on the comment section of this idea!
In my opinion, this stock is at a good opportunity and has good potential for the stock price to go up!

