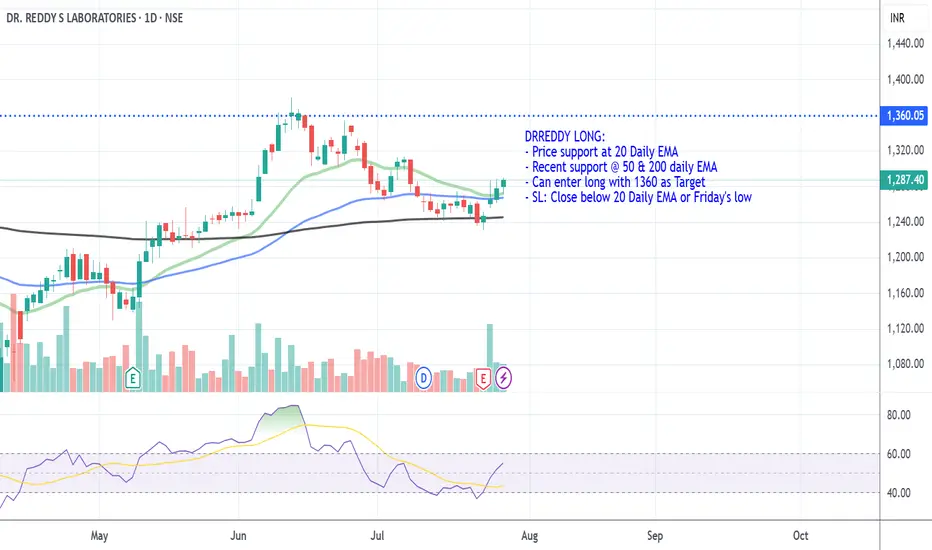
DRREDDY LONG_Support @ 20 DEMADRREDDY LONG:
- Price support at 20 Daily EMA
- Recent support @ 50 & 200 daily EMA
- Can enter long with 1360 as Target
- SL: Close below 20 Daily EMA or Friday's low
R1DY34 trade ideas
Technical bounce back on cardsRevenue: ₹8,545 crore (~11% YoY increase)
Net Profit (PAT): ₹1,418 crore (~2% YoY growth)
North America generics revenue declined ~11% to ₹3,412 crore due to pricing pressures, while Europe surged 142% YoY
Consensus estimates (SimplyWall.st): Average target at ₹1,289, with bullish/bearish range ₹1,660–₹990. Growth forecast modest (~2.9% revenue CAGR through 2026) — down from 13% historical average
Despite milestones in revenue, margins remain under pressure from global competition
For long-term investors: A conservative growth stock with moderate dividend income—best suited for those seeking stability with exposure to generics in key markets.
For traders or momentum players: Watch India- and Europe-driven growth and pipeline developments. U.S. competition remains a major swing factor.

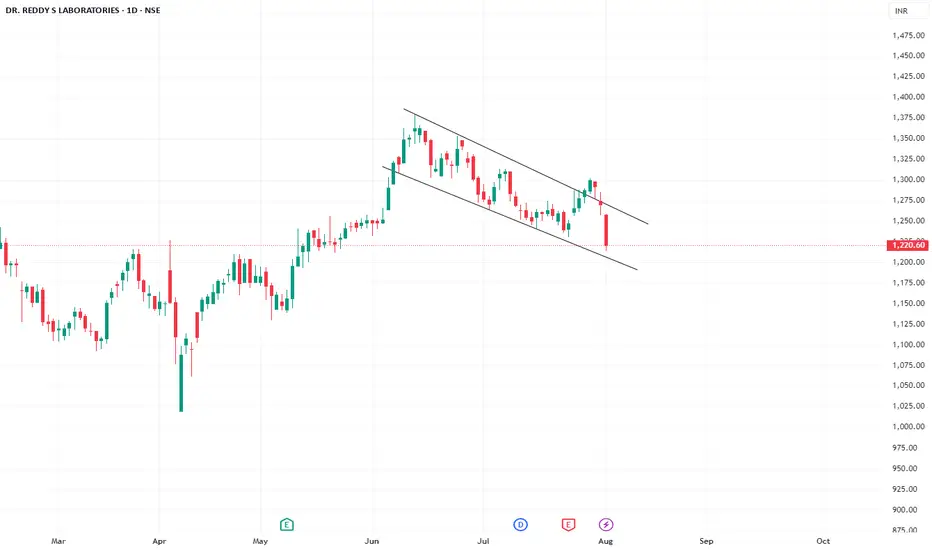
Dr Reddy on a falling wedge !!📊 DRREDDY – Falling Wedge Breakout Analysis
Date: August 2, 2025
CMP (Current Market Price): ₹1,220.60 ( Look for Support or breakdown on trend lines )
📝 Summary:
Dr. Reddy’s Laboratories has broken out of a falling wedge pattern on the daily chart, a classic bullish reversal setup. After weeks of narrowing price action between converging trendlines, the breakout happened with decent volume. This structure generally suggests a potential short-to-medium term upmove, especially if the breakout/breakdown is followed by a retest.
But has entered in the wedge again with a strong bearish candle , so lets respect the trend lines and plan a course of action!
📉 Technical Breakdown:
Price moved within a falling wedge between ~₹1,300 and ~₹1,170 since late June.
The wedge formed over ~30 trading sessions, respecting the upper and lower trendlines.
A breakout occurred near ₹1,225 with a strong bullish candle, closing above the upper trendline.
Volume expanded during breakout, indicating buyer interest.
RSI has turned upward from the 40–45 zone; MACD shows signs of a crossover.
🔑 Key Price Levels:
Type Level (₹)
Retest Zone 1,202 – 1,210
Immediate Resistance 1,240 – 1,245
Volume confirmation is key — look for above-average green candles.
Monitor Nifty Pharma index as a sectoral tailwind may accelerate moves.
DRREDDY LONG_Support @ 20 Daily EMADRREDDY LONG:
- Price support at 20 Daily EMA
- Recent support @ 50 daily EmA
- Can enter long with 1360 as Target
- SL: Close below 20 Daily EMA or Friday's low

DRREDDY Short_Broke down from 20 DEMADRREDDY SHORT:
- Bearish Engulfing Candle
- Support broken 20 DEMA
- Price may retest 20 DEMA before going down (if its going down)
- Enter when the price is favorable in the lower timeframe
- Target: 50 DEMA

DRREDDY_Long_Bounce Back @ 20 Daily EMALooks Bullish.
Support near 20 DEMA
Bullish Engulfing Candle
Target 1360
SL Today's Low 1300
Enter when the Price makes Higher
low or tests the moving Avg

DR. REDDY Is becoming ready for downfallAfter proper price action formation DR. REDDY may fall sharply , my target for next 6 months to one year is 665, lets see what happens, but all this after only confirmation

DRREDDY🎯 Trade Setup Summary
Parameter Value
Trade Type BUY
Entry ₹1257
Stop Loss (SL) ₹1221
Risk ₹36
Target ₹1658
Reward ₹401
Risk-Reward (RR) 11.2
Last High ₹1421
Last Low ₹1020
🧠 Key Observations
Strong Bullish Confluence: All timeframes are in an UP trend, with demand zones stacking up across HTF, MTF, and ITF.
Solid Demand Cluster: Between ₹1210 and ₹1257 — tight overlap across Weekly, Monthly, and 60M charts, suggesting strong institutional interest.
Entry Justified: ₹1257 is both a Weekly and Monthly Demand Proximal, confirming you're entering at the edge of a high-probability reversal zone.
SL Placement: ₹1221 is just below ITF and MTF distal zones — protective but reasonable.
Ambitious but Plausible Target: ₹1658 offers a massive RR of 11.2. Since the last high is at ₹1421, consider a partial booking or SL trail near that level to lock in profits.
Risk Zone: ₹1221–₹1210 must hold — a breakdown here would invalidate the bullish structure.
✅ Actionable Notes
High Confidence Buy Zone: With strong MTF convergence and solid SL structure.
Trail After ₹1420: Lock in gains or use a trailing SL if the price crosses previous highs.
Volume Confirmation: Entry is stronger if supported by a bullish volume surge near ₹1250–₹1260.
🔍 Trend & Demand Zone Overview
Timeframe Trend Zone Type Logic Proximal Distal Avg
Yearly UP Yearly Demand Rally-Base-Rally 1123 730 927
Half-Yearly UP 6M Demand DMIP 1197 1104 1151
Quarterly UP Qtrly Demand BUFL (SOE) 1015 888 952
HTF Average - - - 1112 907 1010
📆 MTF Zones
Timeframe Trend Zone Type Proximal Distal Avg
Monthly UP BUFL 1226 1020 1123
Monthly UP DMIP 1257 1211 1234
Weekly UP DMIP 1257 1193 1225
MTF Average - - 1247 1141 1194
🕒 Intraday Timeframe (ITF)
Timeframe Trend Zone Type Proximal Distal Avg
240M UP S&R 1254 1226 1240
180M UP S&R 1216 1206 1211
60M UP BUFL 1240 1232 1236
ITF Average - - 1237 1221 1229

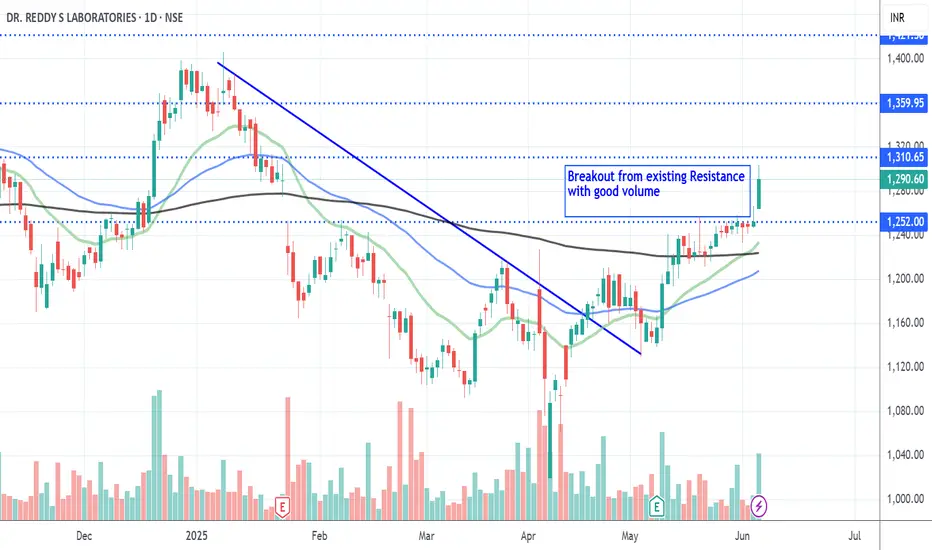
DRREDDY_LongBreakout from existing Resistance with good volume.
Wait till good entry point & Enter.
SL - Price close below 20 DEMA.
Disc: Educational Purpose only.
This chat is education purpose only.Dr. Reddy is ready to break out
Enter at CMP 1240 with SL of 1210
target is 1400.

Review and plan for 12th May 2025 Nifty future and banknifty future analysis and intraday plan.
Quarterly results.
This video is for information/education purpose only. you are 100% responsible for any actions you take by reading/viewing this post.
please consult your financial advisor before taking any action.
----Vinaykumar hiremath, CMT

DR REDDY | SHORT | SWINGAs explained in my earlier post, the weak reversal on DR REDDY has failed.
The stock is now breaking down from the Weekly Pivot and is expected to test 1120 level within this week.
March series could be considered for this.

DR REDDY | LONG | WEAK REVERSAL | BTSTDR REDDY is showing signs of a weak Reversal. This is just profit booking in process of the short positions. The overall trend still remains Bearish.
We can anticipate a price rally towards 1187 price level.
However, the sell off is expected to continue in the coming weeks.
I anticipate the stock to correct towards 1080 price level in the near short term.

Dr Reddy Trading OpportunityWait for Pull back to Fib 0.5 Level
Buy at 1200-1210
SL 1150
Target 1 1300
R:R 1:2

DR REDDY | LONG REVERSAL | BTSTDR REDDY is showing a Bullish price reversal pattern on the Hourly chart.
Buyers stepped in on 30th Jan and stock has been forming Higher Lows since then.
Today the hourly candle too has closed positively indicating that Buyers are firmly in control.
Target - 1271

Dr Reddy Elliot Wave Analysis Dr Reddy elliot Wave analysis weekly time . 1,2,3,4 or 5 complete upside .

Dr reddy for sellAdvantages and Disadvantages of Value Area Trading
Advantages of Value Area trading:
Provides a clear picture of the market’s value.
Helps to identify key levels of support and resistance.
Can be used to generate trading signals.
Disadvantages of Value Area trading:
Can be difficult to identify the value area during volatile market conditions.
May not be effective in all market conditions.
It’s based on historical data and may not take into account future events that could affect the market.
Common Trading Strategies for Value Area Trading
Some common trading strategies for Value Area trading include:
Buying or selling at key levels of support or resistance within the value area
Entering a long position when the price is at the bottom of the value area and exiting at the top
Entering a short position when the price is at the top of the value area and exiting at the bottom
Using the value area to identify potential trend reversals
Using value areas to determine potential stop loss and profit targets
What Timeframe is Best for Value Area Trading?
Value area trading is commonly used in intraday and daily timeframes; however, it can also be applied to weekly or monthly charts. The timeframe used will depend on the trader’s preference and the market they are trading. Intraday charts provide more opportunities for quick trades, while daily charts provide a broader view of market trends.

Analyzing the Market Performance of Dr. Reddy's Laboratories:Analyzing the Market Performance of Dr. Reddy's Laboratories: Trends, Support, and Resistance
Introduction
Lets delve into the recent market performance of Dr. Reddy's Laboratories (DRREDDY), a prominent player in the global pharmaceutical industry. We will examine the stock's technical aspects, incorporating support and resistance levels, trading volume, and options data to provide a comprehensive view of potential trading opportunities and risk factors.
Technical Analysis
Current Price: ₹1288.15
Resistance Levels:
Resistance 1: ₹1305.52
Resistance 2: ₹1322.88
Resistance 3: ₹1332.82
Support Levels:
Support 1: ₹1278.22
Support 2: ₹1268.28
Support 3: ₹1250.92
The trading volume for the current period stands at 738.79K, indicating moderate market activity. Higher volume often signifies strong investor interest and can be an early indicator of significant price changes.
The chart reveals critical resistance and support zones. The resistance zone around ₹1420.00 serves as a potential barrier to upward price movement, while the support zone around ₹1140.00 provides a safety net against significant downward trends. These zones are crucial for traders to make informed decisions regarding entry and exit points.
Options Data Analysis
The options data provide a detailed view of the current market sentiment and possible future price movements of DRREDDY's stock.
Key Observations:
Call and Put Activities:
Significant call writing activity across various strike prices (1300, 1310, 1320, 1330, 1340, 1360, 1380, 1400) indicates bearish sentiment. Investors are selling call options, expecting the stock not to rise above these levels.
Put short covering is observed at most strike prices, suggesting that investors who had previously sold put options are buying them back, possibly anticipating that the stock's decline might be limited.
At strike prices 1350, 1370, and 1390, there is call long covering, implying that traders are closing their long call positions, which could signal an expectation of decreased upward momentum.
LTP (Last Traded Price) and OI (Open Interest):
Higher LTP for puts compared to calls at lower strike prices indicates a higher demand for put options, reinforcing the bearish sentiment.
Substantial changes in open interest (OI) for calls at various strike prices suggest that traders are actively adjusting their positions in response to market conditions. Increased OI in calls generally signifies a buildup of new positions, while decreased OI indicates position closures.
For puts, the changes in OI also reflect market dynamics, with decreases in OI suggesting that traders are closing their bearish positions.
Strategy - DRREDDY 1300 Strike
DRREDDY is showing signs of action – here’s how you can make the most of it!
Strike Price : 1300 Call Option High: ₹35 Put Option High: ₹36.6
Plan of Action:
Focus on the side (Call or Put) that breaks its high first.
Quick Profits : Lock in gains based on your comfort level and market conditions.
Risk Management : Always implement a strict stop loss to safeguard your capital.
Why This Trade?
This strategy is designed to capture sharp price movements, offering potential opportunities in both upward and downward directions. Ideal for traders prepared to act swiftly on breakout levels.
Stay Ready – Don’t Miss Out! Be prepared to execute when the breakout happens!
Investment Implications
Based on the technical and options data analysis, DRREDDY's stock exhibits a balanced risk-reward ratio. Investors should closely monitor the support and resistance levels for potential breakout or breakdown scenarios. Additionally, keeping an eye on options data such as strike prices, built-up positions, and changes in open interest will aid in identifying the stock's future trajectory and potential trading opportunities.
Conclusion
Dr. Reddy's Laboratories' stock chart and options data offer valuable insights for investors and analysts. By understanding the support and resistance levels, volume trends, market sentiment, and options data, stakeholders can make informed investment decisions. As always, it is crucial to consider external factors and conduct thorough research before making any trading decisions.

Dr Reddy Long Dr Reddy can possibly give 8% in the coming days.. Good Movement seen in the last days and so there is a possibility of another 8%!!

DR Reddy weekly and daily chart Strong breakout on both daily and weekly chart
Trend line breakout
Rising volume
Daily RSI >60
Weekly RSI >50
Looks Bullish

DR Reddy Laboratories Swing TradeHello,
Trend-Based Analysis. Buy the Dips, Sell The Rallies, Also Following the Trend. Let's see where the Price Action takes us, Riding the wave. Potential trade setups based on trend momentum.
Technical analysis based on trend identification and momentum, Looking for high-probability setups within the prevailing trend.
Analyzing the current market trend and potential future price movement. Focusing on risk management and reward-to-risk ratios.
Details is Mentioned in Chart, Read carefully.. .
Dr. Reddy | Exited Short | Taken Long | BTSTAs I mentioned in my earlier post today, there was an inherent risk in shorting Dr. Reddy and that came true. Since the price was above the Daily Pivot, the bias was indeed bullish.
A long trade has now been initiated for a target to the above resistance zone. This would be a BTST type trade.

DR Reddy | Short | STBTThis price structure is similar to my earlier post about Bajaj Auto.
Clear rejection from the highs after a gap up opening.
Short position can be initiated for a target to 1230.
This however could be slightly more riskier than Bajaj Auto because the price is above the Monthly Pivot. So that risk element needs to be taken into consideration.
