Dr. Reddy's LabsDRL shows ascending triangle pattern on daily chart. We have to wait for breakout on this chart.
CMP = 4237
Breakout level = 4400
Target = 5000
Stop loss = 2 % below breakout level
R1DY34 trade ideas

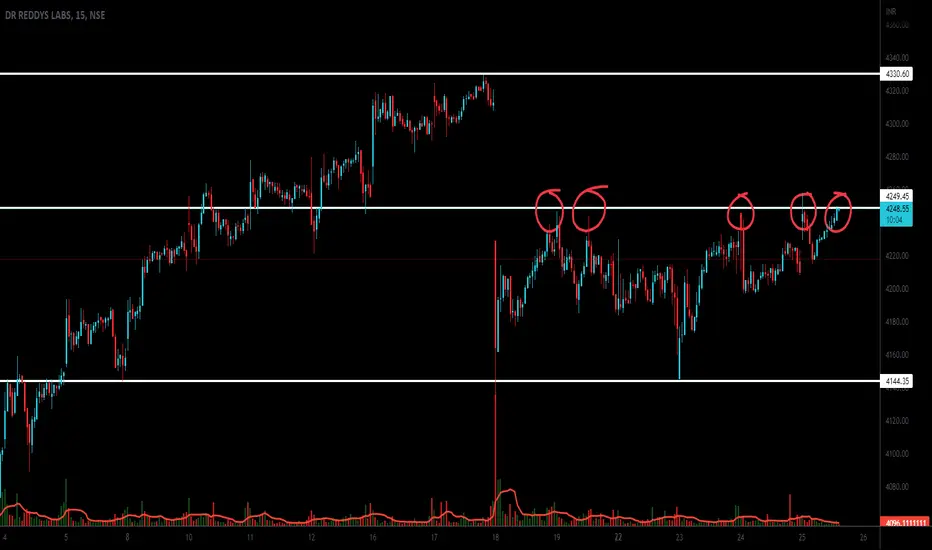
DR REDDY SWING TRADETook support near channel support line and key level
rsi divergence in lower time frame

BULLISH CHANNEL(ASCENDING CHANNEL)THIS IS CONTINUATION PATTERN.
HIGHER HIGH & HIGHER LOWS WITH EQUAL DISTANCE CHANNEL
Wait for Bullish Engulfing candle

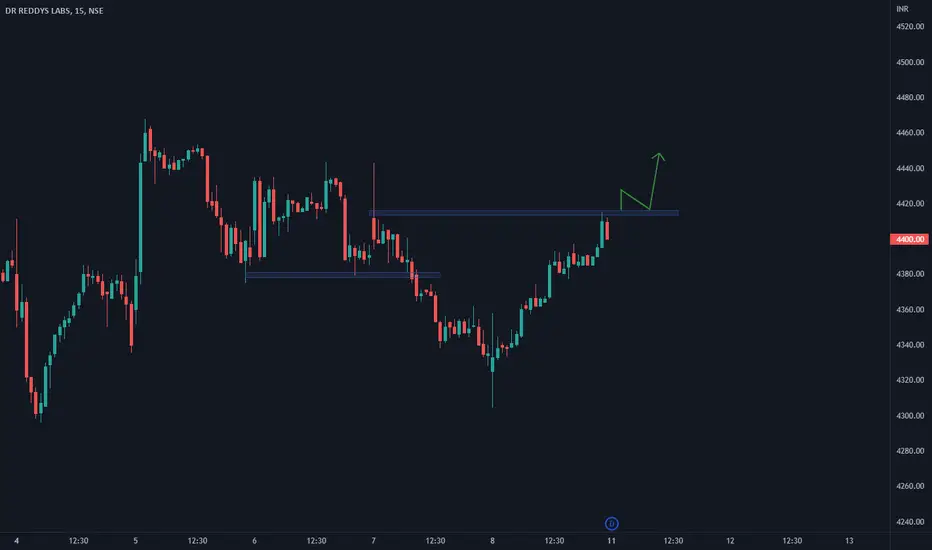
Dr Reddy on Daily chartsIf Dr Reddy sustains above 4000 on daily charts, then it will bounce back above 4400+

DRREDDY sell for intraday tradingDRREDDY sell for intraday trading if stock break the given support level..............

Sell DRREDDY Below 4350NSE:DRREDDY
Pharma Sector looking bearish, If DRREDDY Break 4350
1st TGT 4300
2nd TGT 4150

DRREDDY sell for intraday tradingDRREDDY sell for intraday trading if stock break the given support level........

DR REDDY LABS , has crossed it's ASCENDING TRIANGLE pattern hey guys ,
DR REDDY LAB , stock was moving in a downtrend from a long time,
but now , this stock was moving in a fixed pattern called ASCENDING TRIANGLE PATTERN
at present , this stock has crossed it's RESISTANCE
and taken SUPPORT
as you can see that ,
on previous day , this stock has made a long GREEN CANDLE
and today , this stock has made a candle called DOJI
which has taken SUPPORT on its RESISTANCE
THERFORE , in my opinion you can buy this stock and get high returns ,
I HAVE MARKET THE TARGET AND SL
TO MAKE IT EASY FOR Y'ALL
BUT PLS CONSIDER THE GLOBAL MARKET SITUATIONS
1, INFLATION
2. WAR
3. RISING BANK RATES
4. RISING DUTIES OF CRUDE OIL EXPORT
AFTER CONSIDERING THIS SITUATION
YOU CAN BET ON THIS STOCK
DR REDDY LABS
😀😀

DRREDDY sell for intraday tradingDRREDDY sell for intraday trading if stock and PHARMA sector was also weak then we will enter in trade.........


DRREDDY buy for intraday tradingDRREDDY buy for intraday trading if stock break the given resistance level then we will buy the stock.........
DRREDDY sell for intraday tradingDRREDDY sell for intraday trading if stock and PHARMA sector was also weak then we will short the trade........

#DRREDDY #Priceaction #HADR Reddy 1D: In current market scenario it is preferred to stay with defensives like Pharma / FMCG. In Pharma I see DRL is giving good opportunity to hide behind. HA turned +VE. RSI = 60. Instead any haste rather between 4350 - 4250 can be bought in anticipation of BO for target around 4750 - 4900 with a SL of 4175.

DRREDDY LEVELS...W Candle (27.06.2022)DRREDDY now forms bullish hormonic pattern and breaked trend line ,so we expect 4600-4800 in mid term

DRREDDY BULLISHThere is possibility of 3rd wave. Price took resistance and went down and taking support of 50 EMA and again price is at resistance level. Possibility of Breakout.


Dr Reddy Lab India Sun Storm Investment Trading Desk & NexGen Wealth Management Service Present's: SSITD & NexGen Portfolio of the Week Series
Focus: Worldwide
By Sun Storm Investment Research & NexGen Wealth Management Service
A Profit & Solutions Strategy & Research
Trading | Investment | Stocks | ETF | Mutual Funds | Crypto | Bonds | Options | Dividend | Futures |
USA | Canada | UK | Germany | France | Italy | Rest of Europe | Mexico | India
Disclaimer: Sun Storm Investment and NexGen are not registered financial advisors, so please do your own research before trading & investing anything. This is information is for only research purposes not for actual trading & investing decision.
#debadipb #profitsolutions


Swing Trading StockDr Reddy's laboratories share now made double bottom pattern in one day timeframe.

Dr Reddy's Double BottomRepiston as chart missing in old study.
Double bottom & Breakout from is major resistance.

Dr.Reddys Double BottomDr. Reddy's laboratories Ltd formed double bottom pattern and given breakout to is major resistance level.

buyertomorrow market may be goes to buyer side because drreddy retest and makes green candle and also nifty has buyer momentum
