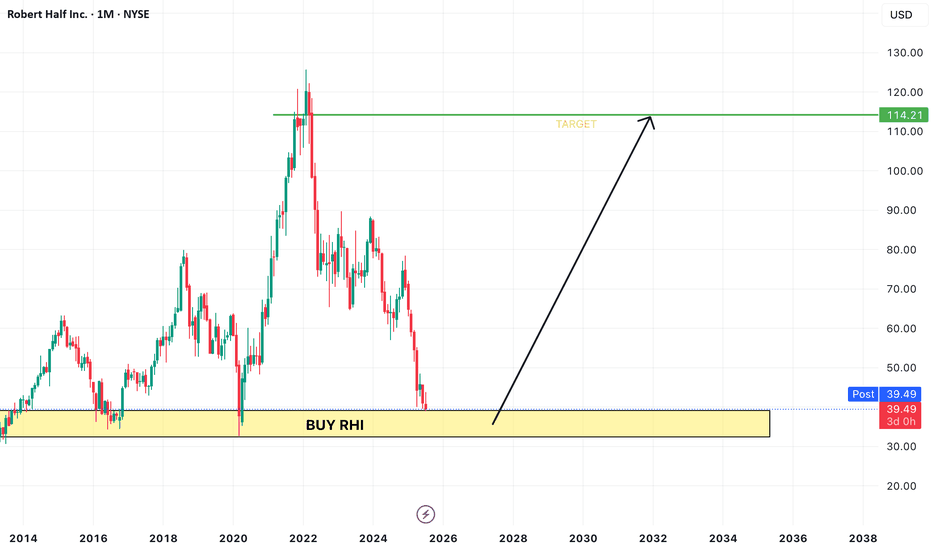
Robert Half | RHI | Long at $37.58Robert Half NYSE:RHI is a company that provides talent solutions and business consulting services in the US and internationally. It's a cyclical stock. Currently, the price has entered my "crash" simple moving average zone ($37-$33) and has historical bounced from this area. This doesn't mean the
22,494.00
0.01 BRL
1.36 B BRL
31.25 B BRL
About Robert Half Inc.
Sector
Industry
CEO
Michael Keith Waddell
Website
Headquarters
Menlo Park
Founded
1948
ISIN
BRR1HIBDR002
FIGI
BBG00RHFNJT0
Robert Half, Inc. engages in the provision of talent solutions and business consulting services. It operates through the following segments: Contract Talent Solutions, Permanent Placement Talent Solutions, and Protiviti. The Contract Talent Solutions segment refers to the fields of finance and accounting, technology, marketing and creative, legal, and administrative and customer support. The Permanent Placement Talent Solutions segment focuses on accounting, finance, tax, and accounting operations personnel. The Protiviti segment solves problems in finance, technology, operations, data, digital, legal, human resources, governance, risk, and internal audit. The company was founded by Robert Half in 1948 and is headquartered in Menlo Park, CA.
Related stocks
White Collar job sentiment has been plunging since 2022Robert Half has been around for quite sometime...I look at this chart as a sentiment indicator for "white collar workers". While white collar workers and the American middle class are not synonymous you could say that many people in the middle class are employed as white collar workers so it is a c
RHI to $68My trading plan is very simple.
I buy or sell when price tags the top or bottom of parallel channels.
I confirm when price hits Fibonacci levels.
So...
Here's why I'm picking this symbol to do the thing.
Price in channel zones at bottom of channels (period 100 52 & 26)
Stochastic Momentum Ind
5/30/24 - $rhi - detailed thinking: i'd remain greedier to buy.5/30/24 - vrockstar - NYSE:RHI - doing a follow up comment here given the stock now at 52wk lows and was flagged to me by a friend to take a look.
1) my valuation comments vs. the 4/25/24 comment don't change much. you're looking at a situation where it's a matter of where bottom EPS is and what
See all ideas
Summarizing what the indicators are suggesting.
Oscillators
Neutral
SellBuy
Strong sellStrong buy
Strong sellSellNeutralBuyStrong buy
Oscillators
Neutral
SellBuy
Strong sellStrong buy
Strong sellSellNeutralBuyStrong buy
Summary
Neutral
SellBuy
Strong sellStrong buy
Strong sellSellNeutralBuyStrong buy
Summary
Neutral
SellBuy
Strong sellStrong buy
Strong sellSellNeutralBuyStrong buy
Summary
Neutral
SellBuy
Strong sellStrong buy
Strong sellSellNeutralBuyStrong buy
Moving Averages
Neutral
SellBuy
Strong sellStrong buy
Strong sellSellNeutralBuyStrong buy
Moving Averages
Neutral
SellBuy
Strong sellStrong buy
Strong sellSellNeutralBuyStrong buy
Displays a symbol's price movements over previous years to identify recurring trends.


