$RBLX GOING FOR NEW HIGHS!???We shall be looking for a push here above ATHs once we make new highs there's no roof so this thing can take off insanely. On the other hands if she decides to pull back then we will see RBLX come down to around $100.44 ish possibly can come back down to $93 lows. Price direction shall easily be distinguished within the first few minutes of the market
R2BL34 trade ideas

RBLX LONGRBLX
Disclaimer - I'm never selling my 1 share haha, I bought it for my nephew in its IPO for his Birthday. Personally, I usually trade penny stocks and below 20.00. I picked this one because it has taught me more than a lot of my usual trades.
The first thing it taught me, was thesis building. I knew about this stock because every time I would visit my sister in the past years, all my nephew was doing was gathering on facetime and playing Roblox with kids at his school. Then I started to play with him and actually saw how many kids were hooked on this and not just hooked but they would print and sell their own characters among each other. It was just a new world.
The second thing it taught me to watch IPO for a Dip if I'm wanted to get in long or on a strong reverse.
The third thing it's teaching me is what is a bigger outlook and thesis for it? With the Metaverse news, is there anything that can happen with Roblox?
Right now I'm watching to see how it reacts to my drawings for its decision on what it wants to do.

RBLXGood play nonetheless to hold in the long term portfolio. Will mostly continue to grow with the way these kids love their video games and games that can involve creativity.
Long since 100$. Targets 120-140$.

RBLX - Roblox Corporation - JUST FOLLOW PRICES The metaverse is a hypothesized iteration of the internet, supporting persistent online 3-D virtual environments through conventional personal computing, as well as virtual and augmented reality headsets. Metaverses, in some limited form, are already present on platforms like VRChat or video games like Second Life

Nasdaq:RBLX-Roblox Corporation - Let's play some game???Been tracking this stock for some time ..
Now time to take some entry
Share my details as blog beofe
Disc: Not invested, will next week as first trance or tracking position.

RBLX - Great Price Action with Breakaway GapRBLX was meandering sideways for 5 months before it staged a strong Gap to "all-time high", breaking previous high water mark @ 105. It then dipped briefly for the next 2 days, retacing 50% of its strong move up (AB).
The gap was partially filled before it quickly staged a strong rebound last Friday.
This chart has the hall marks of the start of bigger trend:
1. Strong breakaway gap out of a consolidation period and into All-time-high
2. Great volume since the breakup
It is likely that the near support is now at ~100, though conservative traders would put the initial stop loss just below it's recent pivot low @ 93.
Trail profits up for a bigger move or consider to scale out partially along the 1.618 and 2.00 fib extensions of CD swing up (~ @125 and 138 respectively) to protect profits.
Let's see if this trade works out!
Disclaimer: TA is about improving our odds of a successful trade (not a guarantee). This is just my own analysis and opinion for discussion and is not a trade advice. Kindly do your own due diligence and trade

rblx shortJUmp on revenue growth and buzz of metaverse buildout... RBLX above +2 sigma looking to drop towards mean/support around 90.50

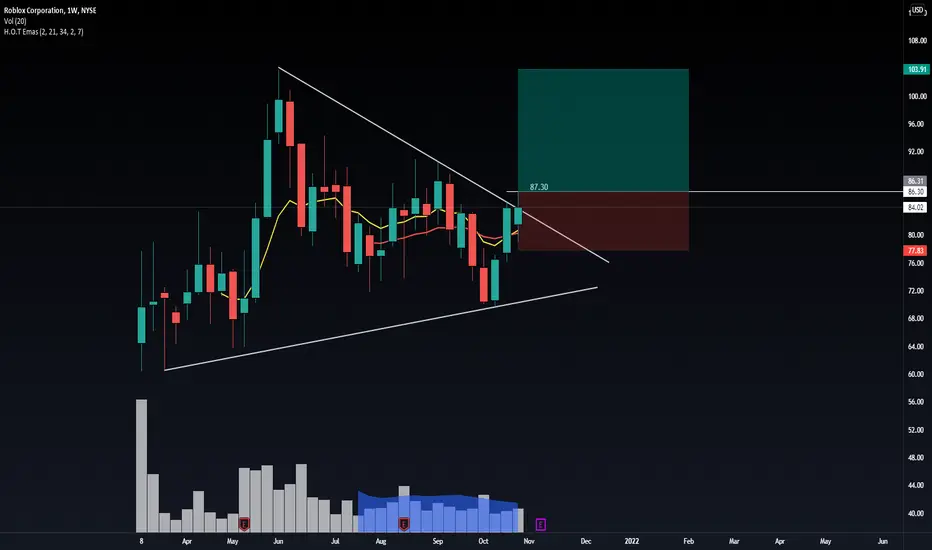
RBLX Massive breakMassive symmetrical triangle in the works and flirting with a breakout.
Watching it above last weeks high, for a possible ER runup
RBLX - RobloxRBLX had a massive earnings gap, opening up nearly +30% from the previous day's close & closing out the day up over 40%.
It has since pulled back, making lower highs & lower lows until this morning. It made an equal low (that undercut the PEG day low) & has since made a higher high.
Bought a starter position. About 40bps risk with my stop at the double-bottom low. Will add to position if it gains traction.

Roblox (RBLX) Sell strategyThe earning report was a surprise, and it also highlighted the extend of the positions in the market. It is overbought, and way out of i's range of the regression channel.
Strategy is SELL current or anywhere between $93-98 for a return to $ 60/share.

ROBLOX - Welcome back to $80After the skyrocket the last days, Roblox is drawing a trajectory to old resistance which may play a role as support.
If the 80s is broken, we may see lower price, but it is unlikely.
I will continue watching this for the near future, best choice for me is 6 months options.
Let me know what you think in the comment section.
Sam.
--------------------------------
Disclaimer,
Not a financial advice, this is for personal use only. Publication is to share personal analysis and opportunities, please trade at your own risk.
Thank you,
Sam.

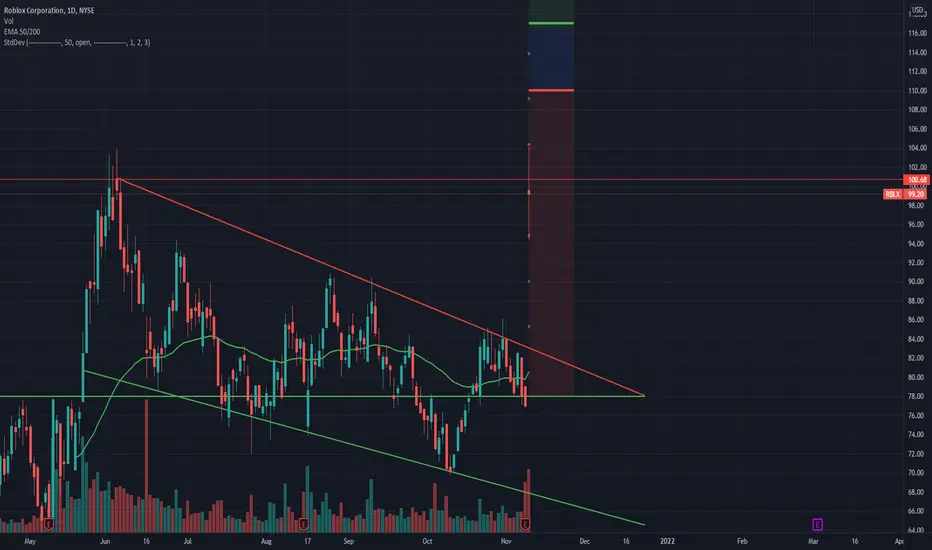
RBLX ATH Break Long Entry Weekly Options Play.Description
RBLX had an unexpected earnings beat and gapped up ~30% AH. A break and hold over 100.68 will mean supply is exhausted and trigger a long.
A close > 100.68 triggers a long.
Using Call Debit Spread, because profit is always limited by time.
Will look to enter at EOD.
Call Debit Spread
Tentative Levels on Chart
SL is a daily close < 100.68.
*Stops based off underlying stock price, not mark to market loss
The Trade
BUY
11/26 110C
SELL
11/26 125C
R/R & Break-evens vary on fill.
Long Call is placed at 110 for reasonable debit on position.
Short Call is placed at highest strike expiring EOM.
Manage Risk
Only invest what you are willing to lose
Huge Bearish Harami at a Shark PCZ if the Daily closes like thisNow may be a good time to buy some December puts near the $90 range.
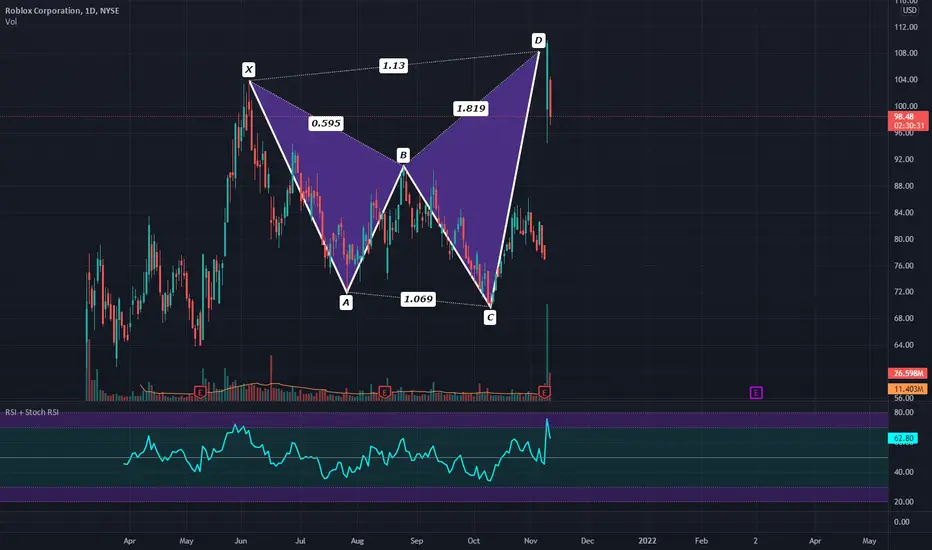
1Roblox Corp. engages in the provision of online gaming services. Its platform consists of the Roblox Client,

RBLX Earnings PlayDescription:
Earnings after close today, taking advantage of high IV on same week options and covering with next week's (Calendar Spread).
Long Call Calendar Spread
Levels on Chart
Break-evens
91.34 +16%
69.01, -12%
R/R: ~4:1
Positive R/R, stop loss levels built into position.
Intend to close before near term expiration.
*Stops based off underlying stock price, not mark to market loss
The Trade
BUY
11/19 79C
SELL
11/12 79C
Only invest what you are willing to lose
Break-evens and R/R vary on fill

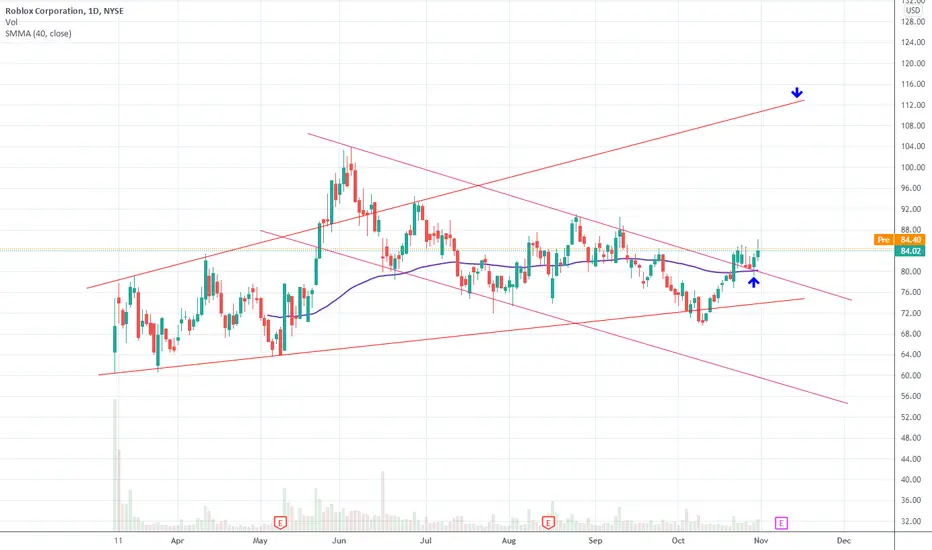
$RBLX Roblox Corporation. Could move higher from here....Breaking out of a channel with some support. Looking for a target around $110
$RBLX Big Gap Post Earnings after the Close$RBLX still on my watchlist.
Trading at around $100 post earning after the close
wowzah!

RBLX- Gravestone Doji at upper channel wedgeGravestone Doji formed at top of the channel wedge.
Rejected at VWAP .

RBLX Next bull rallyHere is what I see with RBLX
~highlighted on RSI is Bullish divergence.
~Vortex indicator is about to change momentum to green
~We have reached a crucial zone of support. If we turn around here we could end up forming a head and shoulders
~We had a higher high, meaning that we could see a trend reversal towards bullish.
~While we did see a death cross on the 1 hour, it was on decreasing volume, meaning a weak death cross. Only going to last a short time before a golden cross returns.
~We are also at the support line of the flag
Earnings on RBLX may be the catalyst we need to start the next bull rally.


$RBLX - Potential descending wedge and inverse head and shoulderThe stock has been in descending wedge unable to break above the upper trend line.
Now looking like inverse head and shoulder is forming with the right shoulder yet to be completed.
As long as the stock stays above $75 there is a chance of bullish reversal.
$84-$85 area is the resistance area and the neck line of this potential inverse head and shoulder that is forming.
Target 1 - $98
Target 2 - $105
Risk - Fall below $75 and retract to $68.
———————————————————
How to read my charts?
- Matching color trend lines shows the pattern. Sometimes a chart can have multiple patterns. Each pattern will have matching color trend lines.
- The yellow horizontal lines shows support and resistance areas.
- Fib lines also shows support and resistance areas.
- The dotted white lines shows price projection for breakout or breakdown target.
Disclaimer: Do your own DD. Not an investment advice.


RBLX not meeting fundamental expectations.RBLX had a robust, retail fueled, run up since IPO. Now that the fun is over, RBLX is showing a lot of weakness ever since. Rejected three times from top resistance and making lower highs. ER is coming up and I am expecting them to beat but not by much. I feel like this wont amount to anything for RBLX and we will continue see downside short term. A nice support for it should be around $69-64.
