$LUV to fly SouthwestSee my previous post on $UAL. Airlines are lookin tight tight tight! Check out $DAL and $AAL too.
S1OU34 trade ideas

LUV Breakout As Summer Closes InLUV is setting up nicely for a breakout with weather warming up. 2% buy range above 60.00. Happy Trading!
luv

Long LUV Cup and Handle. Entered early on yesterdays HammerLong LUV Cup and Handle. Entered early on yesterdays Hammer

$LUV Bullish Cup and Handle patternAirlines are strong, and $LUV is near all-time highs. Bullish Cup and Handle pattern that I am buying.


Swing Trade Underway in LUVTarget conservative, and bail if price comes back to entry (before hitting target) due to the deep retracement and a potential turn lower in that case.

LUV longGood Volume at the $54 level.
Nice bounce possibly at the $51 level. Possibly off the ichimoku cloud as well.
Looks good. I'm long. Short stop loss per usual.

LongI love this stock bullish for tomorow. WHy?
Because the stock just broke a nice symmetrical triangle, because the stock broke a nice resistance line, because the candle of friday was very strong on the upside, because the volume of friday was very high so that shows a lot of interest to the buyers, because the stock just broke the 20MA. I know the 50MA is there but i will putt my buy order above that level to make sure the stock has great potential on the upside.

LUV Swing Long on PullbackSouthwest Airlines (LUV) broke out of a multi-year consolidation in January 2017 and moved up to the $60 level before encountering 2 weeks of selling. Based on a healthy RSI and an unfinished move to the Measure Move target of $63.20, I see the retracement as a potential buy zone.
Target a first entry between $50-51.50 and a 2nd entry around the $48.50 support.
I will update with option pricing as we near the entry targets.

Southwest Airlines Losing Some LUV?On March 30, 2017 Southwest Airlines Co. (LUV) 20 day moving average (MA) crossed below its 50 day MA. Historically this has occurred 94 times. When this happens, the stock does not always continue to drop. It has a median gain of 3.775% and maximum gain of 52.802% over the next 10 trading days.
When we take a look at other technical indicators, the relative strength index (RSI) is at 47.8715. RSI tends to determine overbought and oversold levels. I personally use anything above 75 as overbought and anything under 25 as oversold. The current reading declares the stock is neutral and looking for direction.
The true strength index (TSI) is currently -5.0019. The TSI determines overbought/oversold levels and/or current trend. I solely use this as an indicator of trend as overbought and oversold levels vary. The TSI is double smoothed in its calculation and is a great indicator of upward and downward movement. The current reading declares the stock is trending down.
The negative vortex indicator (VI) is currently 1.0680. The VI determines current trend and direction. When the positive level is higher than 1 and higher than the negative indicator, the overall price action is moving upward. When the negative level is higher than 1 and higher than the positive indicator, the overall price action is moving downward. The current reading declares the stock is trending downward but the positive vortex indicator is climbing and the negative indicator is beginning to drop.
Considering the moving average crossover, RSI, TSI, and VI levels, the overall near-term stock direction appears to be slightly trending downward. Based on historical movement compared to current levels and the current position, the stock could drop 3.86% over the next two weeks. The stock recently broke out of its upward trend channel and has entered a narrower down channel. The exact width of the current channel is still to be determined. There is noticeable support around 51.75 which could be met in the near-term.


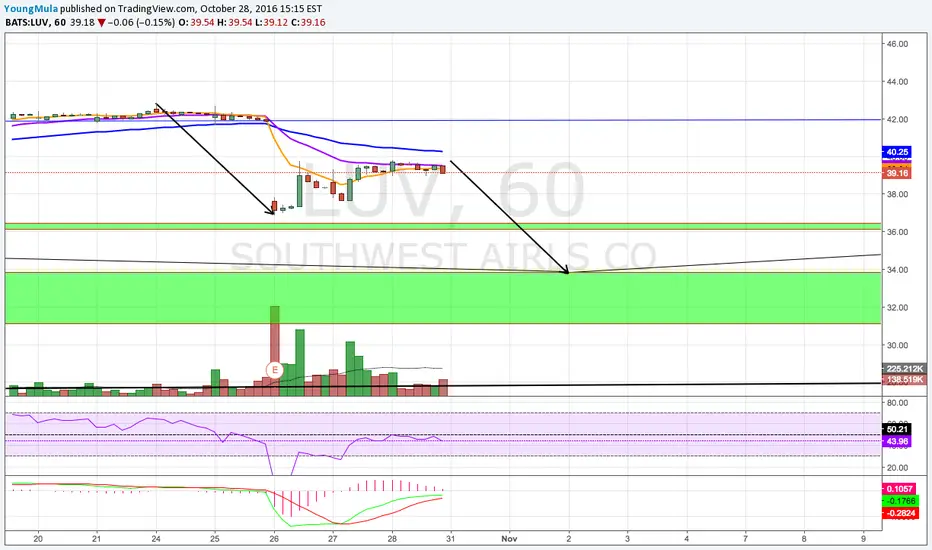
A Hard Landing Ahead For Southwest?The bears might want to use the occasion and drag the stock back down to the support of wave 4 in the $35-$30 area.

Southwest AirlinesBuying pullback here to demand level.
Entry: $54.77
Stop Loss: $54.24
Target 1: 57.50
Target 2: 60


TRIANGLE BREAKOUTWe have had a breakout of triangle pattern on weekly timeframe to upside.
You can wait for a pull back to a triangle and enter to trade or use own strategyt to jump.

LUV longI entered this stock today at 52.30ish on average as it was holding its gap up nicely and showing strength in an overall weak market and although airlines were sold off due to trumps travelling to the U.S. ban notice


Nice pattern in $LUV. Time to go long with a $1 stoplossNice rounding formation at a higher potential bottom. I am thinking to go long


[Long LUV] Southwest Airlines - Ready for take-off!Put your seatbelt on because after 10 months of delay we're finally cleared for take-off
If you're worried about possible rise in WTI prices, hedge it using either ETFs or Futures.
My in-house analysis show building of a major medium/long term bullish momentum.