The bull need to breath - why soybeans is close to a correction.Since the beginning of November, the soybean market has rallied 23.5% on the back of a very bullish story (Chinese demand and some weather fear). We all know that in a healthy and constructive bull market, we always have some profit-taking and dips along the way…Technically the market is showing some exhaustion in the short term, which may bring some profit-taking and downside pressure at the beginning of 2021 (and buying opportunity)….
Today’s price action makes me believe that if we break the lows of 1280 basis SH21, the profit-taking/selling pressure can accelerate in the short term, which may bring prices to the 38% and 50% of Fibonacci retracement levels (blue box). This blue box (1200/1150 interval) is also the level where a big chunk of the recent longs were taken, as we can see in the volume by price profile (horizontal bars on the right).
This 1200/1150 area the market will try to defend and is targeting as strong support going into the beginning of 2021!!
The bull is still alive and strong going into 2021 - BEANS BACK TO THE TEENS
SJC1! trade ideas


SoyBeans (ZS1!) LONG; Long term BUYCBOT:ZS1!
.
Looks like it's headed >$15000, rather relentlessly.
This very well could get up there something like this;

Sell Soybean (MAR2021)Sell from current and 1340.00, stop 1400.00, target 892.50
Transfer of position c (ZSF2021), due to the short expiration time of the contract.


Soybean futures ZS - EW analysis Soybean futures ZS - It is about to finish the impulse cycle with one more high as C wave as ABC flat correction in 4 hr time frame.
Give thumbs up if you really like the trade idea.

ZS1 long #long #soyabean
But 1220 area
Stop 1190 exect
Target 1490
Soyabean gave breakout in weekly and monthly too
Dollar is making lower low so this trade have 95 percent probability to hit the target


Grain and oilseed markets summary 12/14Today we discuss how the grain markets weekly opening day closed and risk levels where our trades get invalidated


Week 50: Short Opportunity on ZSF 2021Weekly analysis for ZSF2021
Week 50: 07 December to 11 December 2020
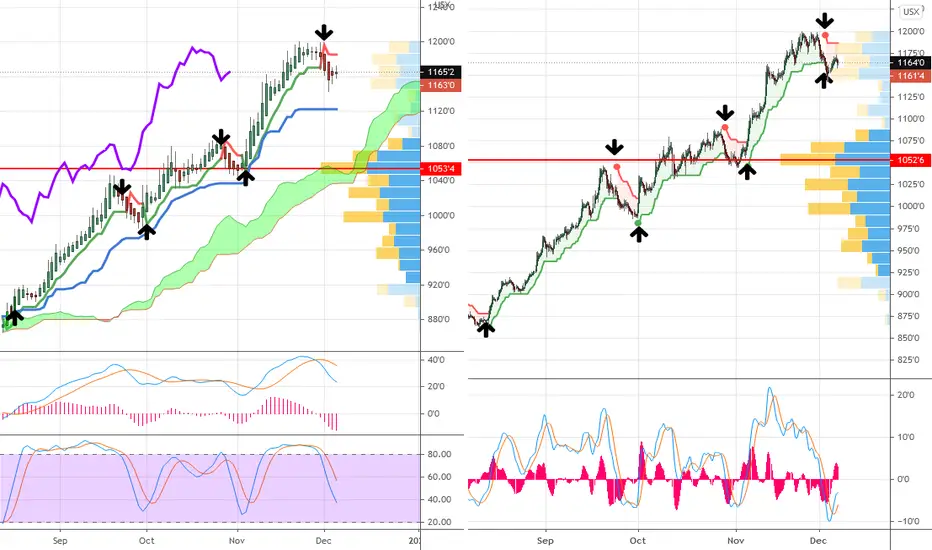
Following up last week analysis, the Resistant level at $1,200 remained in tact and our key level at $1,161 had been penetrated.
Therefore, now we are looking to sell as the direction had changed.
Here is my personal trade call for this week :
Short now or Sell Stop at $1,154.00
Stop Loss (SL) is at $1,175.00
Take Profit (TP) is at $1,083.00
It gives us 3.47R
Disclaimer :
The analysis above for educational purposes only, I do not responsible for your losses. Please adjust your own lot-sizing according to your appetite.
If you are benefiting from my trade opinion, please buy me coffee.
As always, move your SL when you are in the profit zone.

Soybean huge uptrendThis is the type of uptrend that I love. Three good strong up-legs on soybean 4hr. Would have been great trading calls on this. I was too nervous about the liquidity to buy calls on it.
Price targets, Profits and Plans to ExitOne of the most controversial issues about investment and/or trading is the topic of knowing a profit/price targets. In a way, it is about seeing into the future and deciding that is the end goal, for some.
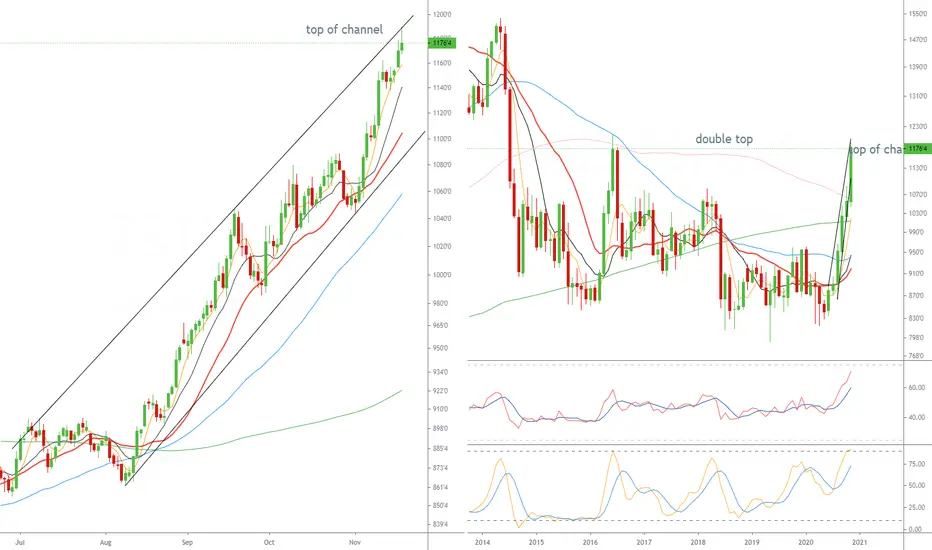
By using the support and resistance lines , we can better guide ourselves towards this goal. Like in the Soybean Chart , we can see that there were two price points - 26/2/18 and 06/06/16 peaks. Those investors who had bought at the high price back then would be waiting impatiently to get rid of this commodity asap. Thus, we can see a healthy correction at 1078 price level where it is also the resistance level.
Then, it surpassed that level and prices continue to go higher. Now, at 1201, we are again facing the peak last visited at 06/06/16. Now, that is 4 over years ago. Those investors who are still holding this are bleeding in their accounts for so long and are dying to get out soonest possible.
For that, we see the last 2 red candles, which means some selling action. Apart from those who bought at high and awaiting to sell , there are of course, the opportunistic short term short sellers who take advantage of price actions and trade it for a quick profits.
So, like a see saw, the heavier side will win. If enough bulls over the next few days/weeks continue to support the price, then , we can see a bullish continuation pattern where it breaks above the resistance level at 1201.
Now, every chart is different and so the sector that it is IN. This is crucial ! For example, we are now witnessing a sector rotation where certain tech stocks are going through a correction (Netflix, FB, Apple, Amazon, etc) and Banks and Energy stocks are basking in the sun and putting on a big smile to the bull traders/investors !
For stocks, I generally do not sell , that is no plans to EXIT the business UNLESS it has fundamentally change its nature of business, suffers badly in terms of numbers, etc .
For commodities, currencies, indices , cryptocurrencies, etc, I do have short and mid terms position in them.
On profits and profit targets - this is how I look at it . It is important to know when to sell and once the profits is in your pocket, that is when you truly knows you have made it, never mind the monetary amount. Use some of it to reward yourself.
Look at the price points in the chart as a NEVER ENDING ROPE. The knots at the ropes are your resting points or take profits zone. Once you took the profits, you assess where the rope is heading , is it up, sideway or down. You decide what strategy to use to climb the next journey and plan where is the next knot/profits zone.
Of course, you may not reach all knots that you think you have set out to achieve. Sometimes, before you reach it, you slipped and fall a few steps (similar to price pull back and evaporates all your profits) OR you were distracted while climbing and decided to jump ship to the next rope adventure (from one position to the next by closing the first position). Again, it is hard to say if this is right or wrong as everyone assess the market differently and we need to respect that.
Sometimes, you are in the wrong boat and it is wiser to take a short term pain to end it by bailing out rather than to ride it to the wrong destination. If you hope it will detour and bring you to where you wanna go, you may be in for a surprise.
I wanted to write this from my personal experience as I get comments or PMs from followers asking me on this or that stocks where is the profit targets?
The fears come when you start to chase high price and then you have no ideas where to exit , fearing it might reverse sooner than expected. That is why the trend lines, supports and resistance, price action , all combined helps me to reach a decision.
I hope this is helpful to some of you out there. Again, I may not be able to reply to your questions/comments/Pms immediately so I appreciate your patience and understanding.


Trade #6 / Tuesday, December 1, 2020 / 21:17 / Sell ZSTrade #6 / Tuesday, December 1, 2020 / 21:17 / Sell ZS

Soybeans: Trending up, buy on dips...I think we have a nice setup to buy the dip in Soybean futures or using $SOYB. It's a rather big contract, so keep that in mind if trading futures.
There's a long term trend signal active, for many more months still, so any dip is a buy if you're patient enough.
I highlight a trend that reached its peak in the daily timeframe here, so, a retracement entry is likely to materialize in the coming days and weeks.
Keep an eye on it, don't miss out on the big gains to be had in this market.
As @timwest pointed out, fundamentals for Soybeans and the long term chart are ridiculously bullish now, so, it is going to be very hard to hold on to positions for long enough to reap the benefits, and specially hard to join the trend for most people. The droughts in Brazil are affecting crops, and there's a huge demand from China, since the soybean producing regions were affected by floods recently, there's also a big need for soybeans to produce pork in South America, like the huge farms they are setting up in the South of Argentina.
As a bonus, if the US wants to hurt China, their best bet is to make the food prices go up, specially Soybeans. They had been buying commodities for cheap for a long time until now. That might be changing already, and considering the expectations I have of rising inflation and interest rates, in a post Pandemic world, this is further fuel for the fire in this rally here.
Cheers,
Ivan Labrie.

Week 49: ZSF 2021 Still bullishWeekly analysis for ZSF2021
Week 49: 30 November to 04 December 2020
Here is the playbook for Week 49, overall it is still Bullish.
(a) Currently on H4, the price is forming a bullish flag with $12,000 is the current Resistance Level.
(b) It may not be a straight forward bullish; the real key level is at $11,161.50 (area).
What does this mean?
(1) If the price make a clean break on $12,000 then we put a Buy Limit at $12,000 area
(2) If the price just make a shy break on $12,000 level, then we are expecting either a False Breakout or another price compression.
(3) If the price cannot break $12,000 it is still Bullish, don't get trapped by thinking that the trend has changed. The direction is only changing after the price enters $11,161.50 and below.
Therefore, overall this week is still bullish bias; take a rational decision, don't get emotion involved.
Disclaimer :
The analysis above for educational purposes only, I do not responsible for your losses. Please adjust your own lot-sizing according to your appetite.
If you are benefiting from my trade opinion, please buy me coffee.
As always, move your SL when you are in the profit zone.


Gold Commodity Markets11.23.20 I wanted to finish up on my GOLD review from this weekend. The main point that I wanted to make about gold is that there are different trades for different types of traders in that area, and while you may understand how markets like this can appeal to both buyers and sellers in a fairly narrow range, it doesn't mean that it will be your kind of a trait because of your rules. In my own trading, I had to make a distinction between knowing how to read the market, and what markets are suitable to trade regardless of how I read the market. At some point you have to decide what type of trading is most suitable for your personality, and your capabilities. Trading is a business and you want to stay in business, and you want to like your business, and you wanted to be dependable. It doesn't make sense to trade your business as a lotto ticket. Some businesses require a little less time, and this is important because the determination of what kind of a trader you want to be changes many aspects of your trading including the amount of time that you will have to be watching your trading screen.
I ran through some commodity markets that I think will be useful to my students who are far enough along that they may benefit by looking at some commodity markets. There are many reasons for these markets to move higher and lower, The probability of inflationary influences on the markets is very high, and I suspect that you'll see some great trading agricultural markets as well as other commodities markets moving higher as inflation becomes more apparent.

Week 48: ZSF 2021 No sign of weakness, key level is at $1,150Weekly analysis for ZSF2021
Week 48: 23 to 27 November 2021
From 1st June 2020 until today, Soybean prices has been very (strong) bullish, especially in November.
On the weekly Time Frame we can spot the decision level is at $1,150, however from the current price is still quite far.
There is no sign of reversal yet, even on Daily chart, momentum still slower, sporadic with some keen buyers trying to push the price higher.
Practically we have not seen any strong Sellers come to intervene, perhaps just like us and other traders, we just wait and see on how high the price will go.
It is wiser to wait, observe and we enter when there is a firm confirmation on the price.
No trade call this week, risky to long and not wise to short now. Stay Calm and enjoy the Black Friday shopping.
Disclaimer :
The analysis above for educational purposes only, I do not responsible for your losses. Please adjust your own lot-sizing according to your appetite.
If you are benefiting from my trade opinion, please buy me coffee.
As always, move your SL when you are in the profit zone.

Week 47: ZSF 2021 Short OpportunityWeekly analysis for ZSF2021
Week 47: 16 to 20 November 2021
After a long rally, retracement was formed (in a mini down trend channel) and it broke to fill the Supply Zone.
There two ways to trade this formation:
(a) Aggressive Mode
Solely based on the Price Action and we can reap better Risk Reward Ratio by sacrificing a small risk.
Sell Limit at $1,153
Stop Loss at $1,160
Take Profit at $1,124
RR = 4.14R
(b) Conservative Mode
We wait for the confirmation to enter, it is a very safe trade with a decent ratio.
Sell Stop at $1,139
Stop Loss at $1,152
Take Profit at $1,124
RR = 1.31R
Use your own judgement and risk factor to decide.
My personal opinion, this week ZS will have a rather big movement and from there it will be many ranging days ahead.
If you are familiar with "Cancan Setup", you may know what I am referring to.
Disclaimer :
The analysis above for educational purposes only, I do not responsible for your losses. Please adjust your own lot-sizing according to your appetite.
If you are benefiting from my trade opinion, please buy me coffee.
As always, move your SL when you are in the profit zone.
