SONY GROUP GOING UPPrices for Sony Group Corporation have finished the inverse Head and Shoulders setup and are currently in the neckline within a bullish flag on the daily time frame ,now it is the best time to enter at 83.53
SNEC34 trade ideas

$SONY with a bullish outlook following its earnings #StocksThe PEAD projected a bullish outlook for NYSE:SONY after a negative over reaction following its earnings release placing the stock in drift C with an expected accuracy of 66.67%.

SONY GROUP CORPORATIONHello ladies and gentlemen, according to my graphical analysis of SONY GROUP CORPORATION , there is a high probability of a decline towards the 104 USD level in the next few months!

Sony Group Corporation DCA - Inverted head and shoulders + C&HCompany: Sony Group Corporation
Ticker: 6758
Exchange: TSE
Sector: Electronics
Introduction:
Hello and thank you for taking the time to read my post. Today, we analyze the daily chart of Sony Group Corporation, focusing on an interesting combination of two price patterns, an inverted head and shoulders and a cup and handle pattern. This combination provides additional confirmation for classical chart analysts and offers a compelling trading opportunity.
Price Patterns:
Inverted Head and Shoulders: This pattern has been forming for 384 days and features a clear horizontal resistance line at ¥12,380. This serves as our reference point for the pattern.
Cup and Handle: The right shoulder of the inverted head and shoulders pattern contains a 126-day old cup and handle pattern, which provides further confirmation and a second possible price pattern. The same horizontal resistance line at ¥12,380 serves as the reference point for this pattern.
Bullish Environment:
The price has been above the 200 EMA for some time, indicating a bullish environment.
Price Targets:
Inverted Head and Shoulders: The price target for this pattern is ¥15,520, representing a potential price increase of 25%.
Cup and Handle: The price target for this pattern is ¥14,725, representing a potential price increase of 19%.
Trade Opportunity:
A breakout has occurred, making this trade actionable without further observation.
Conclusion:
The Sony Group Corporation daily chart analysis highlights the combination of an inverted head and shoulders pattern and a cup and handle pattern. This provides a compelling trade opportunity with clear price targets. As always, it's essential to consider risk management and proper position sizing when trading based on chart patterns.
Please note that this analysis is not financial advice. Always do your own due diligence when investing or trading.
If you found this analysis helpful, please like, share, and follow for more updates. Happy trading!
Best regards,
Karim Subhieh

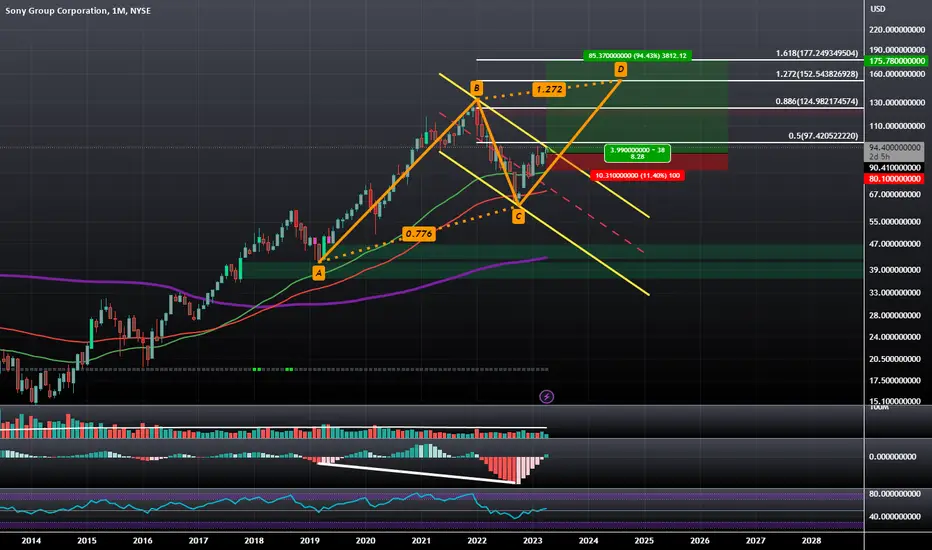
$SONY: Monthly Hidden Bullish Divergence and Channel Breakout NYSE:SONY on the Monthly Timeframe is breaking out of a Descending Channel while confirming Hidden Bullish Divergence and Bullishly Crossing over on the MACD and the RSI enters the Bullish Control Zone; the next obvious target would be between 150 and 177 Dollars as that would be the completion of an AB=CD Harmonic Pattern. One last thing to note on the side is that the NASDAQ:MSFT acquisition of NASDAQ:ATVI has recently hit a brick wall with regulators and this is likely to spur some optimism in the NYSE:SONY camp who has opposed this acquisition in fears that Microsoft would eventually make games like Call of Duty, Xbox Exclusive.
6758: Sell ideaOn 6758 as you see on the chart we have a sell idea because we have the breakout with force the vwap indicator by a big red candle with a large red volume.Thanks!

SONY buy candidate Strong earnings raised guidance.SONY just made it above 200SMA. There is high probability of continuation as the fundamentals improve. Moreover, SONY increased Revenue guidance for 2023. To note that revenues from PS are flat but Sony raised prices.

$SONY with a Bullish outlook following its earnings #Stocks The PEAD projected a Bullish outlook for $SONY after a Positive over reaction following its earnings release placing the stock in drift B with an expected accuracy of 88.89%.

Sell ideaAs you see on the chart we are in a bullish channel situation. We will have a reversal trend (downtrend) if the vwap indicator and the support line are broken with force by a big red candle with a large red volume. In other hand we could have an uptrend continuity if the resistance line is broken with force by a big green candle with a large green volume. Thanks.


SONY BRIGHT FUTUREWith sony stock shares jumping on the electric car partnership with Honda this gives sony significant room to grow and expand i believe Sony stock will go far beyond $130 but that is more of a longer term outlook over the next 5 years and wouldn't rule out $200

$SONY with a Bullish outlook following its earnings #Stocks The PEAD projected a Bullish outlook for $SONY after a Positive over reaction following its earnings release placing the stock in drift B with an expected accuracy of 100%.

SONY | Extremely Oversold | Short Term PopSony Group Corporation designs, develops, produces, and sells electronic equipment, instruments, and devices for the consumer, professional, and industrial markets in Japan, the United States, Europe, China, the Asia-Pacific, and internationally. The company distributes software titles and add-on content through digital networks; network services related to game, video, and music content; and home and portable game consoles, packaged software, and peripheral devices. It also develops, produces, markets, and distributes recorded music; publishes music; and produces and distributes animation titles, game applications, and various services for music and visual products. In addition, the company produces, acquires, and distributes live-action and animated motion pictures for theatrical release, as well as scripted and animated series, unscripted reality or light entertainment, daytime serials, game shows, television movies, and miniseries and other television programs; operates a visual effects and animation unit; manages a studio facility; and operates television and digital networks, and post-production facilities. Further, it researches, develops, designs, produces, markets, distributes, sells, and services televisions, and video and sound products; interchangeable lens, compact digital, and consumer and professional video cameras; projectors and medical equipment; mobile phones, tablets, accessories, and applications; and metal oxide semiconductor image sensors, charge-coupled devices, integration systems, and other semiconductors. Additionally, it offers Internet broadband network services; recording media, and storage media products; and life and non-life insurance, banking, and other services, as well as creates and distributes content for PCs and mobile phones. The company was formerly known as Sony Corporation and changed its name to Sony Group Corporation in April 2021. Sony Group Corporation was incorporated in 1946 and is headquartered in Tokyo, Japan.

Sell for SonyConsidering the political and economic conditions of the world, my prediction is that in the future and the medium term, the stock markets of the world and especially the Western bloc will decrease. I feel the same way about Sony stock and everything about the details of my trade is clear in the picture. This is a two-to-one position. Due to the coverage of possible political situations and crises, I have made the stop loss large. I don't think a miracle will happen in the fundamental conditions of the company, but any analysis is just an analysis and there is a possibility of its failure. disclaimer

$SONY with a Bullish outlook following its earnings #Stocks The PEAD projected a Bullish outlook for $SONY after a Positive Under reaction following its earnings release placing the stock in drift A with an expected accuracy of 50%.

SONY AnalysisPrice is on a downtrend, and could be at the start of a wyckoff accumulation schematic. Price is currently filling the fair value gap, so I expect a short-term retracement into the bullish POI at 82.08. If price respects the bullish POI, we could see price targeting AR at 95.70. If we fail to respect the bullish POI, we might be looking at the formation of a spring to start an uptrend.

SONY GROUP CORPORATIONBreakout of the blue trendline on January 19, after that we have several retests of the green trendlines. If we retest the oblique green trendline and cross 10970 yen, we go sell.

SONY GROUP CORPORATION (SELL)Market in decline ( RSI ), breakout of a curved trendline; the decline in the price already started could continue further if we break through the level of 75 dollars.
Stop loss : 95
Take profit : 40

SONY CORP, STOCK LONG TERM ANALYSIS SONY - LONG TERM ANALYSIS , DISCLAIMER: Use this analysis by your own risk

$SONY with a Neutral outlook following its earnings #Stocks The PEAD projected a Neutral outlook for $SONY after a Negative Under reaction following its earnings release placing the stock in drift D with an expected accuracy of 25%.

SONY LONG SETUPWe're expecting the price to bounce back. Right now, on daily timeframe we can see it is lower than Keltner Channel's bottom and that RSI just entered in the overbought zone and that means the price could start to rise again soon. If today's entry level won't be hit we will simply move entry price (pink) SL (red) and TP (green) to a lower level.


SONY Monthly OverextensionSONY has hit this area many times,
occasionally it results in a small pullback and continuation of the bull run, which i think is the situation we are in right now (hammers)
A massive downward channel can also be drawn on this Monthly chart (very difficult to execute a trade on this timeframe)
Indicator is called 'ZigZag Cloud'
