Week 46: ZSF 2021 Buy at retest levelWeekly analysis for ZSF2021
Week 46: 09 to 13 November 2021
Market was pushing the price higher and made a new Higher High last week.
The Head and Shoulder formation was not happening, on Friday the momentum was slower and today not much happening too in Asian session.
Overall trend is still bullish, but don't jump to the band wagon now; we better wait at a retest level to long.
My personal trade call for this week :
Buy Limit at $1,084
Stop Loss at $1,061
Take Profit at $1,130
RR = 1.92R
Special note :
As there is no reference on the Take Profit, we do not know how bullish it will be.
My advise, watch for the Price Action in H1 and H4; they will give you an early warning whether to close manually or let it ride.
If I happen to watch it, I will update it here on comment section.
Disclaimer :
The analysis above for educational purposes only, I do not responsible for your losses. Please adjust your own lot-sizing according to your appetite.
If you are benefiting from my trade opinion, please buy me coffee.
As always, move your SL when you are in the profit zone.
SOY1! trade ideas

Soybean Trend Change Hello!
This idea is based upon a cycles analysis as well as a system that is best described a conformal geometry.
Risk to reward ratio is approximately 1:10, currently short 3 contracts with the intention to roll them as necessary. This idea only covers the trade itself, the analysis behind it will be outlined in another idea published to my profile. Stay tuned.


Week 45: ZSF 2021 Consolidation PhaseWeekly analysis for ZSF2021
Week 45: 02 to 06 November 2021
Overall, this week I am very bearish bias.
There are two spots of level which give us a good profit ratio:
(1) Sell Limit at $1,065
(2) Sell Stop at $1,035
There is no trade call today (this week), just a few guidelines:
a. If you are shorting now or still haven't closed your trade from last week position, the best Take Profit level is at $1,036
b. If you are looking to sell, wait for the price to breach $1,035 or bounce to $1,065 or split your lot size with heavy on top.
c. Stop Loss is at $1,067 (close all your short positions if the price is closed at this level or higher)
d. Take Profit is at $1,000
e. Last advise, keep in mind that now the price is forming the head, it needs to form the right shoulder before going down.
Disclaimer:
The analysis above for educational purposes only, I do not responsible for your losses. Please adjust your own lot-sizing according to your appetite.
If you are benefiting from my trade opinion, please buy me coffee.
As always, move your SL when you are in the profit zone.

Not so sexy Soybean will shine once again!Check out this quarterly linear chart for Soybean Futures. Along with sugar and silver, very inflation sensitive move above to get going. A bullish cross on true strength index deep below zero could signal a strong move up. Very early still yet. $zs_f #soybean #inflation #debt #gold #silver $slv $gld #fintwit $sil $silj $gdx $gdxj


SoyBean - Wedge Breakout Multi Timeframe Sell IdeaD1 - Bullish cycle completed with bearish divergence.
H4 - Wedge breakout. Looking to sell pullbacks

Week 44: ZSF 2021 Bullish compressionWeekly analysis for ZSF2021
Week 44: 26 to 30 October 2021
Soybeans is persistently soaring higher and higher, there was no sign of slowing down.
Even today, there is no strong seller sighted yet; looking at from the momentum movement, the market may show a sign of deceleration.
However, until we see a Strong Seller, then we can say that the momentum has changed direction.
Actually I won't rush to sell, because the data is not complete yet.
The only reason I will place a Pending Sell Order, it's because of the compression shape, or commonly known as ascending wedge.
Again, this is a risky trade, no reference to the left and let's speculate. We have a good RRR for this trade.
My personal trade call:
Sell Limit: $1,082
Stop Loss: $1,090
Take Profit: $1,047
Risk Rewards Ratio: 4.67R
Disclaimer :
The analysis above for educational purposes only, I do not responsible for your losses. Please adjust your own lot-sizing according to your appetite.
If you are benefiting from my trade opinion, please buy me coffee.
As always, move your SL when you are in the profit zone.

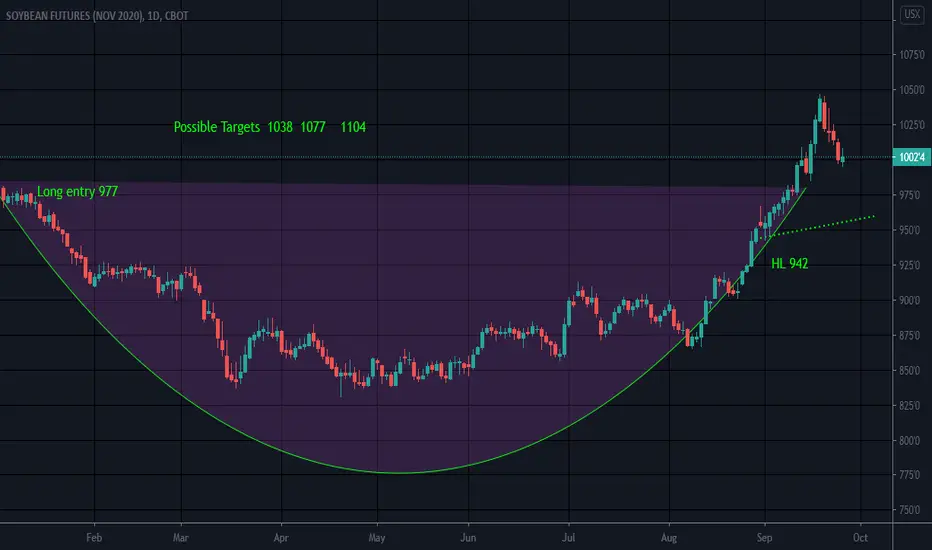
Cup and HandleContract November 20
Possible stop below handle low or mid cup (MC)
Long entry level 977
Not a recommendation


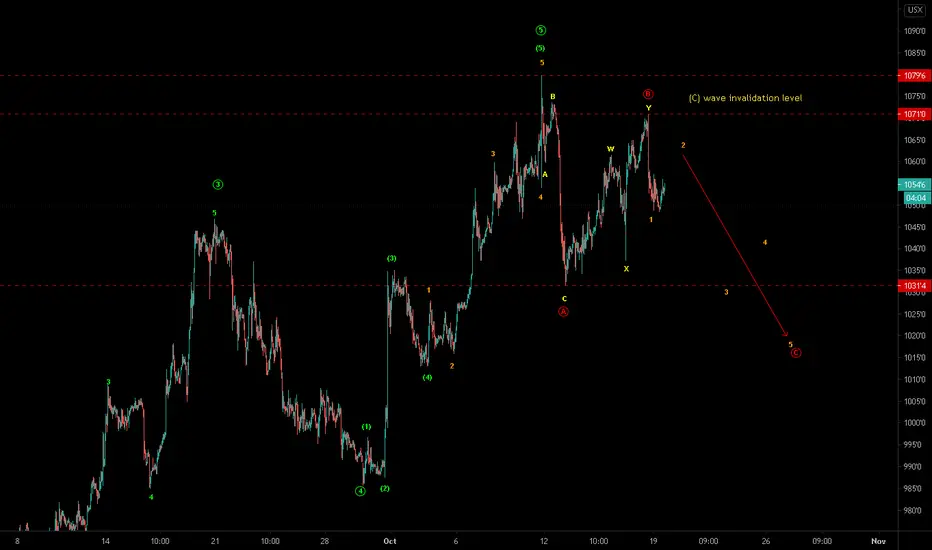
ZS1! - Soybeans futures - Elliottwave analysis Welcome guys,
CycleWave is the top author sharing trade ideas based on EW analysis since last five months on the global stocks, currency pairs, cryptos, future indices and commodities. You can follow us to get more trade ideas/analysis.
ZS1! - Soybeans futures - It is within flat correction as ABC, where 1st of C wave down seems over and 2nd wave is in progress, so sell it down with stops above 1071 near 1056-63 zone for target zone up to 1028 or lower. The trade is having medium odd set up.
Give thumbs up if you really like the trade idea.


Week 42: How high can it go?Weekly analysis for ZSX2020
Week 41: 12 to 16 October 2020
This is the second time for ZSX2020 flying into the unknown area.
Normally in this scenario, I will long at the RBS area; however, now it's a bit late for that.
How high can it go? we do not have the data, again, it's best to wait and see until the price dives below $1,047.
This week no trade call, just watched and we can focus on forex or other asset classes.
Disclaimer :
The analysis above for educational purposes only, I do not responsible for your losses. Please adjust your own lot-sizing according to your appetite.
If you are benefiting from my trade opinion, please buy me coffee.
As always, move your SL when you are in the profit zone.


Week 41: Quick short on ZSX 2020Weekly analysis for ZSX2020
Week 40: 05 to 09 October 2020
So far the price failed to make a Higher High and still lingering at $1,020 area.
Based on the Price Action, it is now a good sign to do short.
Should the price dropped lower than our Take Profit level, then we anticipate the price will go below $1,000 next week.
My personal trade call:
Sell Limit: $1,019
Stop Loss: $1,029
Take Profit: $1,003
Risk Rewards Ratio: 1.62R
Disclaimer :
The analysis above for educational purposes only, I do not responsible for your losses. Please adjust your own lot-sizing according to your appetite.
If you are benefiting from my trade opinion, please buy me coffee.
As always, move your SL when you are in the profit zone.

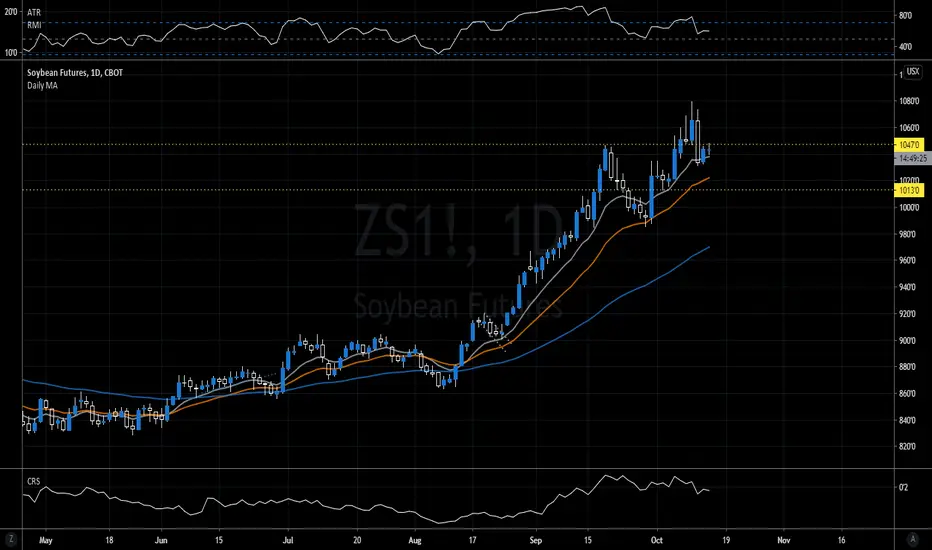
Smart money adds to extreme soybean shorts According to last weeks commitment of traders (COT) report which covers positions held amongst three groups of traders (Commercial hedgers more commonly known as the Smart Money hedgers, Non-commercials and Non-reportables) through Tuesday the 29th September showed the Smart Money is still aggressively shorting Soybeans along with agriculture commodities in general. Their total shorts against agriculture contracts hit another multi-year low, with extreme bearish readings on Soybeans, in particular, totalling -218,443 contracts at (3) (previous week -201,737 contracts).
Non-commercial (funds etc) positions totalled 239,872 contracts, an increase of 21,306 contracts from the week prior. And Non-reportables (small speculators) totalled -21,429 contracts (previous week -16,829).
It’s important to note that when commercial hedgers reach multi-year extremes, as they are now, they have a tendency to drive the markets. In contrast to that, non-commercials who typically always take the opposite side to the commercials usually get caught out at these likely turning points. From a technical perspective, the soybean weekly chart suggests we are toying with multi-year overhead resistance zone (R) and weekly prices are being capped by the 400 period moving average, which has proven to be a reliable source at turning points.
Smart money trade set-ups, such as this one are for the mid to long term.

We are getting close to trend changeIt has been a long time since my last Soybean forecast. It is time to pay attention to this market. It is setting up for the decline. Commercials are heavily selling, the seasonal tendency is to the downside, and Insider Accumulation is turning bearish. So, if on Monday we get below Friday’s low, that will be a sell signal. However, it seems like it will take more time to form some pattern. We may see a very short-term rally followed by a sell signal formation. Don’t hurry and wait for confirmation. We have a good setup, but timing matters a lot in this business.

Week 40: ZSX 2020 Bullish resumptionWeekly analysis for ZSX2020
Week 40: 28 September to 02 October 2020
After a long rally, market needs to take a breathe before continuing the journey to the North.
Your question would be, this time how high the price will be?
As a trader, we do not speculate, but we react based on the price movement.
Let's put it simply, if there is no Higher High (HH), then we anticipate the price will go lower next week.
If there is a HH, then the trend will continue.
This week, we wait until the price reach to our last week Take Profit point, that's where we will LONG ZSX2020.
My personal trade call:
Buy Limit: $991
Stop Loss: $980
Take Profit: $1,020
Risk Rewards Ratio: 2.51R
Disclaimer :
The analysis above for educational purposes only, I do not responsible for your losses. Please adjust your own lot-sizing according to your appetite.
If you are benefiting from my trade opinion, please buy me coffee.
As always, move your SL when you are in the profit zone.