$STZ - double bottom?This stock scares me
is there a double bottom?
is it making a W?
screeners love it for criteria I use to find investments.
STZB34 trade ideas


$STZ with a slight bullish outlook following earning release$STZ is projected to have a slight bullish outlook as per the PEAD model after a positive over reaction following its earning release placing the stock in Drift B
If you would like to see the Drift for another stock please message us. Also click on the Like Button if this was useful and follow us or join us.
Ascending ChannelThere is a small, but evident ascending channel forming on this chart. If it breaks out to the upside that would be bullish. I would target long term, a measured move of the triangle height. Shorter term I would scale out at the resistances of 229 and 234. If, and only if, it breaks the resistance with volume. Not financial advice.

Well Well Well....look what's brewing! 208.55 clearance much needed now more than ever for ath's
$CGC high's


STZ daily trade idea 10012020STZ just reported earnings and it looks really strong, for that reason there are two ways to trade, wait for 109,57 zone as a support to look for longs or we can have a gap and go

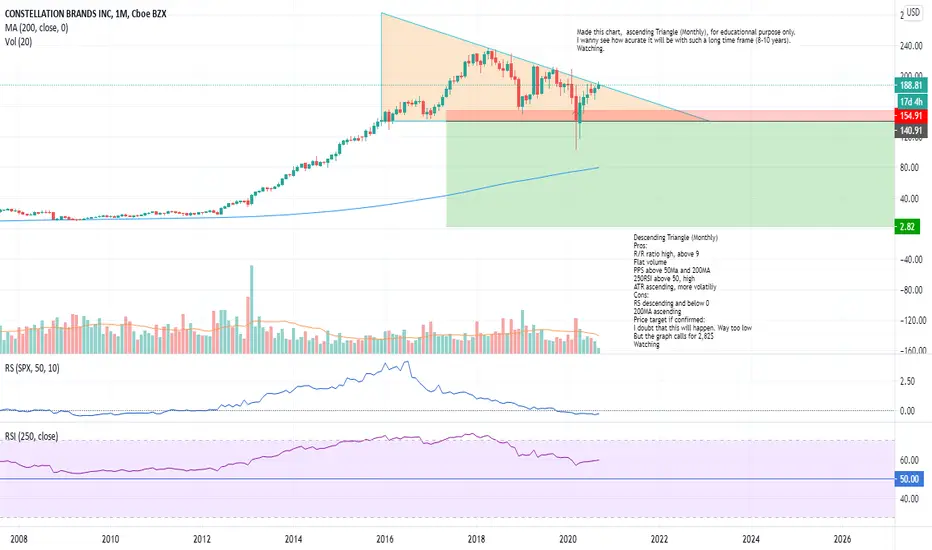
STZ: Descending Triangle, Watching for educationnal purposeDescending Triangle (Monthly)
Pros:
R/R ratio high, above 9
Flat volume
PPS above 50Ma and 200MA
250RSI above 50, high
ATR ascending, more volatiliy
Cons:
RS descending and below 0
200MA ascending
Price target if confirmed:
I doubt that this will happen. Way too low
But the graph calls for 2,82$
Watching
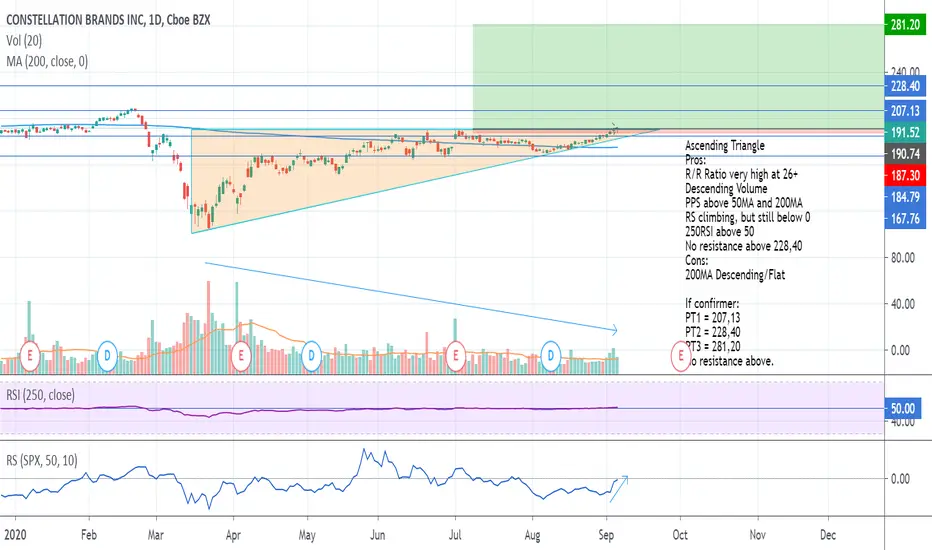
STZ: Ascending triangleAscending Triangle
Pros:
R/R Ratio very high at 26+
Descending Volume
PPS above 50MA and 200MA
RS climbing, but still below 0
250RSI above 50
No resistance above 228,40
Cons:
200MA Descending/Flat
If confirmer:
PT1 = 207,13
PT2 = 228,40
PT3 = 281,20
No resistance above.
STZ struggles to rally from a rounding bottom After triple top, $STZ may have found support just above $171 with the rounding pattern. The stock should have rallied from the bottom of $171, but the volume has been very low and the uptrend is currently unable to sustain itself. There may be resistance at around $187.

STZ at the bottom of channel.Stz has been here before dipping below the upward channel. Looking for an intraday re-entry unless something out of the ordinary happens.

$STZ Bullish Crossover - Downtrend Breakout$STZ Constellation Brands (Corona/Modelo/etc) Bullish Crossover - Downtrend Breakout
Bullish 50D/200D ema crossover. Breaking out of recent downtrend.
Near term target: $200-$205 range by mid August
Note: Not investment advice

$STZ Constellation Brands Price Targets
A break above the 200ma on the daily could result
in a nice rally on the back of good earnings.
Local trendline resistance @ $186
Multiyear downtrend resistance @ approx $196
PLEASE GIVE US A LIKE IF YOU FIND OUR CONTENT HELPFUL, THANK YOU.

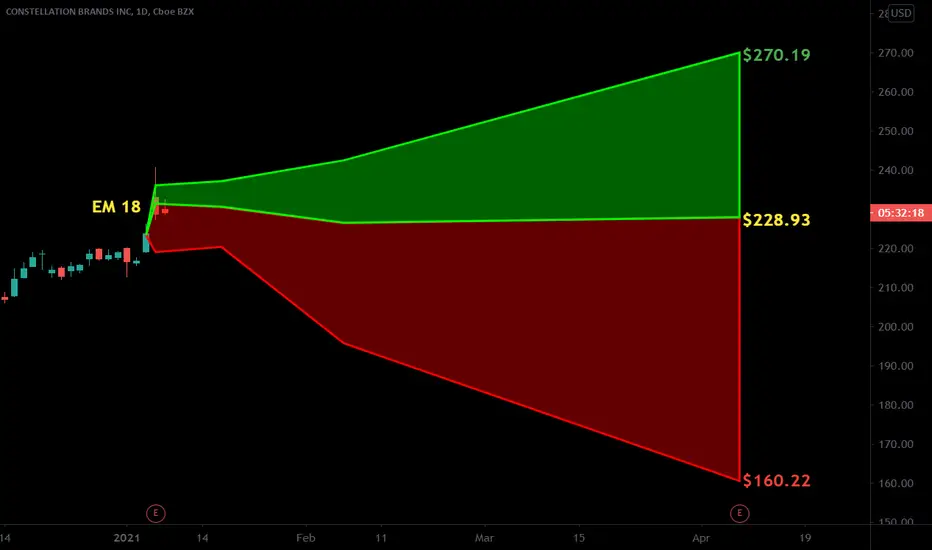
V bottom and Consolidating Earnings in amSTZ announces earnings in the am BMO
Risky business to trade before earnings...and STZ is a long way from breaking out of it's V bottom
If the market responds well to earnings, the stock will most likely break out. If the news is received poorly, STZ may hit the gap under 149.5
Either way, risk is high. I hate these because if they beat earnings and the stock breaks out, it is likely I will never catch it. If it misses and hits the gap, if I still want it I can catch it there. A lot of ifs! Monthly candle is a doji so it tells me it can go either way. )o:
Target 1: 272 to 282
Target 2: 340 to 370
I would put my stop under the gap down at 149.


Expect a retest of long term support trend line.Hello everybody,
I got bored and charted a few stocks. If this reaches the trend line, I would suggest picking some up at a discount. Happy trading!


All the Corona[viruses] in the World #corona #coronavirusJust imagine what an $8B bailout from the gov't would do to this bad boy.

Long STZJust publishing this for own personal accountability and practice.
Looking to enter long calls (March 13/27) 210 and possible 230 leaps
if we can get a weekly close above 205.50

Canopy helps Constellation Brands
Possible inverse head and shoulders on the vberge of breaking.
Canopy earnings on Friday a obvious help, as there is some glimmer of recovery for the Cannabis stock that STZ has invested heavily in.
Will look for volume spike in the days to come.

Long Idea - Self Talk13/Dec/2019 08:02 PM AUTHOR: Brandon Gum
--
Targeting a RSI downtrend line break that then drives price action to test the RSI uniformity line(horizontal line on RSI)
The stop makes sense to me. Im unsure on the target.
------------
I wish I had something to live for. Feel like letting go.
I use to have it all.
======================

STZ showing strength, oversold w 200 Day support and CGC comingEoY 2018 plus Canopy investment caused a fall out of long term range. An improvement in CGC (currently oversold) means a likely return to that range, which means a possible run to $240 by EoY 2020. Even if it doesn't recapture the previous trading range, it is at the bottom of this one. Expect a near term jump especially with CGC earnings coming up.
