7/22/25 - $tmo - Probably top 10 HC name on my "buy" list7/22/25 :: VROCKSTAR :: NYSE:TMO
Probably top 10 HC name on my "buy" list
- as HC (healthcare) stonks are at multi-year lows and basically everyone is bearish - positioning is important to account for when calling stock inflections
- i'd say... here's a pick and shovel name that has great FCF yie
26,195.24
0.00 BRL
34.15 B BRL
231.16 B BRL
18.12 B
About Thermo Fisher Scientific Inc
Sector
Industry
CEO
Marc N. Casper
Website
Headquarters
Waltham
Founded
1956
ISIN
BRTMOSBDR007
FIGI
BBG00CRHLXR1
Thermo Fisher Scientific Inc. serves the scientific community through a broad offering of innovative products and services. Thermo Fisher Scientific serves customers working in pharmaceutical and biotech companies, hospitals and clinical diagnostic labs, universities, research institutions and government agencies, as well as environmental, industrial, research and development, quality and process control settings. The company’s global team delivers an unrivaled combination of innovative technologies, purchasing convenience and pharmaceutical services through its brands, including Thermo Scientific, Applied Biosystems, Invitrogen, Fisher Scientific, Unity Lab Services, Patheon and PPD. The company continuously increases its depth of capabilities across its broad portfolio of innovative products and services and leverages its extensive global channels to address customers’ needs. The company does this through organic investments in research and development, capacity and capabilities and through acquisitions. The company’s goal is to enable its customers to be more productive in an increasingly competitive business environment, enable them to accelerate innovation, solve their challenges and advance their important work. The company’s history roots back to the year 1956 when the business was first established. Thermo Fisher Scientific was formed in 2006 from the merger of Thermo Electron and Fisher Scientific and is headquartered in Waltham, MA.
Related stocks

$TMO, Long, TP>15-25%NYSE:TMO , Long, TP>15-25%
Fundamentally the stock is good.
Choose an entry point and do not forget about a protective order if you are trading with leverage.
Don't risk it if you're not sure.
Good luck to everyone.

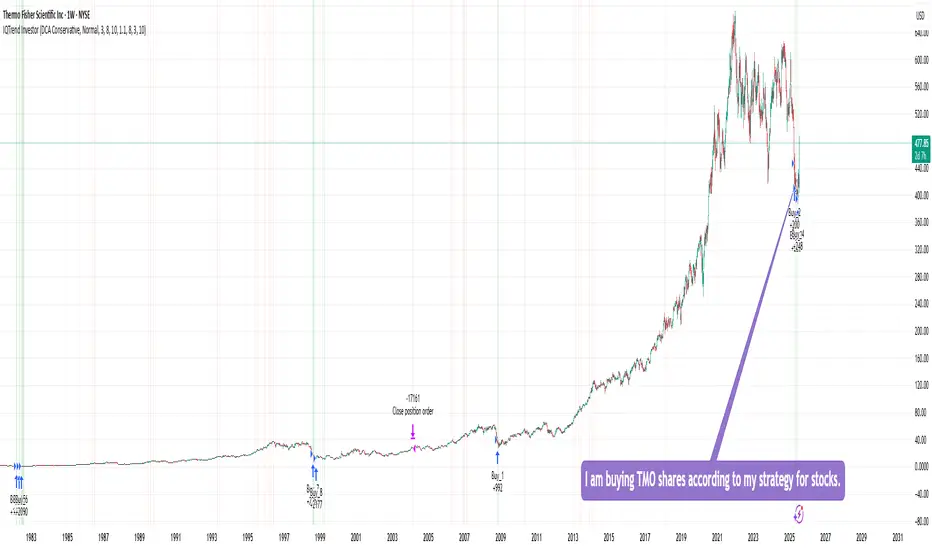
Buying TMO sharesI am buying TMO shares according to my strategy for stocks, ETFs, and precious metals.
This strategy shows 100% performance on this stock on a weekly timeframe. Therefore, I am investing a small percentage of my deposit in it and will wait for it to perform. I hope that everything will work ou
TMOclearly oversold, waiting for buy signal. first target would be VWAP around 436. this is also right where a massive volume shelf is...

3 Oversold Stocks Poised for a Rally – MAS, IQV & TMOBelow is today’s SmartApingAI snapshot of three highly oversold names showing early signs of a rebound. Scroll down for a quick refresher on each company’s fundamentals, key technicals, and what makes them attractive at current levels.
1. Masco Corp ( NYSE:MAS )
What They Do:
Masco designs, m

Still uncertain of continuing decline on 2 oscillatorsThe support matches that of the past, a fall from a 100 may not be enough to stop it, but inside the channel, as long as the break from it lands on that support line shy of 500, then we have a counter bounce which could prove a significant possibility gaining 20 points. Target 520 with a trailing st
Plus on Thermo Fischer. TMOThe last take on TMO brought 7.5% profit in 13 days. It was manly based on Harmonic/RSX OBOS combo signature. The change in the candle stick tendency now might be an earliest of the earliest signs of a pivot. This is a very risky take, given limited evidence: Stoch/RSI cross, vWAP cross, US support

Betting on Cool Down at Thermo Fischer. TMOIt's not a perfect butterfly, but I am willing to take a shot given the wealth of evidence in the background from our algorithmic indicators. MIDAS cross line plus resistant vWAP and US, which also crossed 4-5 candles ago, plus cross on VZO and heralding cross on Stoch/RSI. BB %PCT is about to flip

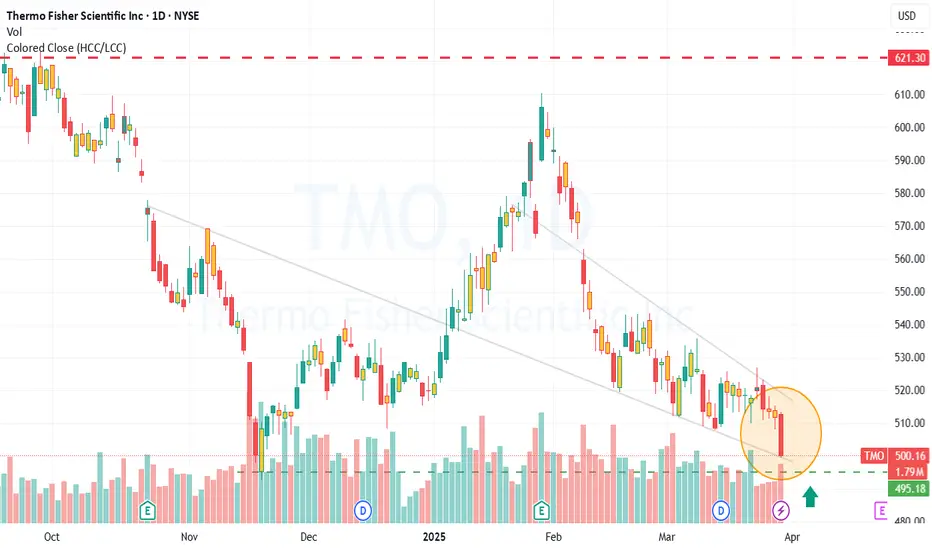
TMO Long Idea- Price has retested and held the weekly descending trendline
- on the daily timeframe, price has formed 5 waves and is holding the 0.618 retracement
- enter now with a stop loss at the previous swing low around 494
- upside levels to watch: 540, 570, 620
- beyond 620, new ATHs can be expected

looking at sub 500 levels just can't seem to find the bottomReading many timeframes and patterns, it's a simple concept along with good or bad fundamentals, and of course, the catalyst is to sell the news or buy the speculation. In this case, reading the chart, we see oscillators that are turning to the downside, we don't see confirmation of the bottom, we s

See all ideas
Summarizing what the indicators are suggesting.
Oscillators
Neutral
SellBuy
Strong sellStrong buy
Strong sellSellNeutralBuyStrong buy
Oscillators
Neutral
SellBuy
Strong sellStrong buy
Strong sellSellNeutralBuyStrong buy
Summary
Neutral
SellBuy
Strong sellStrong buy
Strong sellSellNeutralBuyStrong buy
Summary
Neutral
SellBuy
Strong sellStrong buy
Strong sellSellNeutralBuyStrong buy
Summary
Neutral
SellBuy
Strong sellStrong buy
Strong sellSellNeutralBuyStrong buy
Moving Averages
Neutral
SellBuy
Strong sellStrong buy
Strong sellSellNeutralBuyStrong buy
Moving Averages
Neutral
SellBuy
Strong sellStrong buy
Strong sellSellNeutralBuyStrong buy
Displays a symbol's price movements over previous years to identify recurring trends.
TMO4530434
Thermo Fisher Scientific Inc. 4.1% 15-AUG-2047Yield to maturity
5.78%
Maturity date
Aug 15, 2047
TMO4078058
Thermo Fisher Scientific Inc. 5.3% 01-FEB-2044Yield to maturity
5.41%
Maturity date
Feb 1, 2044
TMO5630948
Thermo Fisher Scientific Inc. 5.404% 10-AUG-2043Yield to maturity
5.27%
Maturity date
Aug 10, 2043
TMO5710956
Thermo Fisher Scientific Inc. 5.2% 31-JAN-2034Yield to maturity
4.68%
Maturity date
Jan 31, 2034
TMO5630927
Thermo Fisher Scientific Inc. 5.086% 10-AUG-2033Yield to maturity
4.57%
Maturity date
Aug 10, 2033
See all TMOS34 bonds