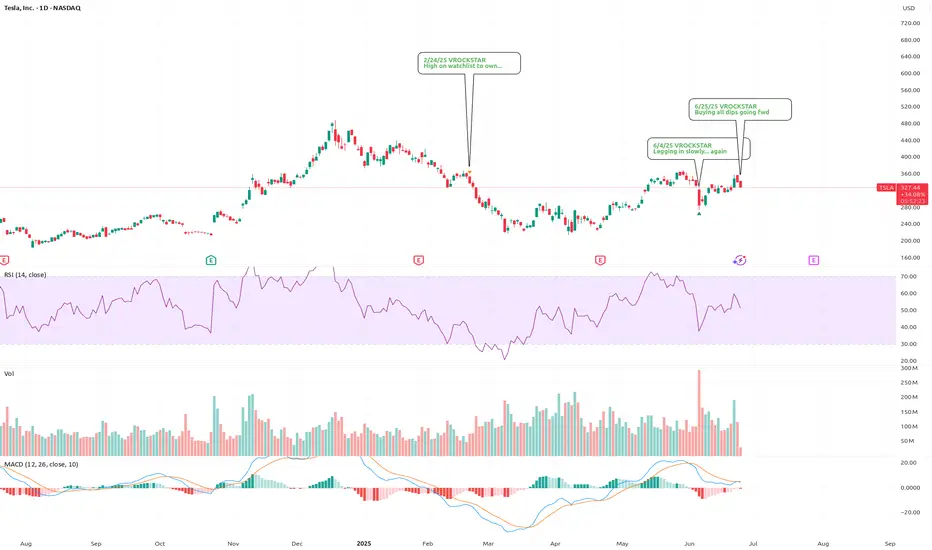
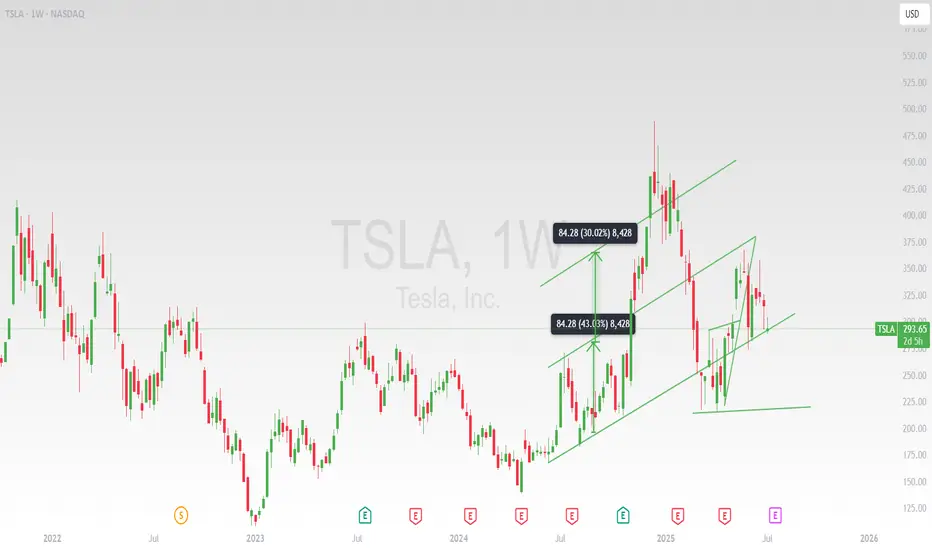
6/25/25 - $tsla - Buying all dips going fwd6/25/25 :: VROCKSTAR :: NASDAQ:TSLA
Buying all dips going fwd
- "successful robotaxi or not successful robotaxi"
- elon's clearly won the vision game
- scaling hardware (cars, infra, optimus, solar) is m-o-a-t
- so is a humanoid and robotaxi robotics company that doesn't burn cash worth a trilly in today's world if the upside is perhaps 5-10 tn in the coming decade (worst case) and your downside here is what? 30... 40... 50%? Is it more? unlikely.
- so "yes" we remain entering consumer recessy. yes "tsla" shares r not cheap. and that's for a reason.
- buy scarce paper.
- buying all dips here.
- i like the dec '27 deep ITM leaps. allows me to wrangle size with a bit more flexibility in the coming months.
- but this rocketship has yet to make any meaningful moves.
- $1,000/shr is the 2Y tgt.
V
TSLA34 trade ideas
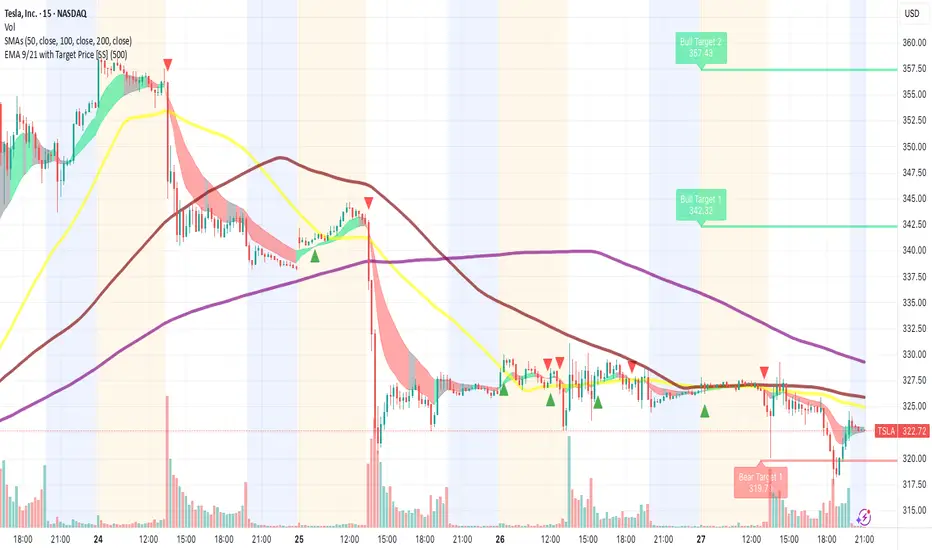
TSLA Bearish Breakdown in Progress – $322 or Bust? TSLA Bearish Breakdown in Progress – $322 or Bust? Monday Puts On Watch 🔻
🧠 GEX-Based Options Sentiment:
Tesla is currently trading right at a critical GEX flip zone. The $330 level used to be gamma support but has now broken, leaving TSLA vulnerable to a drop toward the high-risk gamma pocket between $320–$310.
The Highest positive GEX zone was stacked near $330–$340, but that structure has failed. The gamma walls above—like $347.5 and $350—now serve as resistance, especially with no strong call flow to support a squeeze.
The downside gamma structure is open. $310 is a soft magnet, but $300 is where the largest negative GEX sits, along with the 2nd and 3rd Put Walls. If TSLA continues slipping, a drop into the $300 zone could be swift.
Implied Volatility Rank is at 25.2, with IVX above 68 — meaning options are expensive, so spreads are safer than naked calls or puts. Flow is still 8% call-heavy, but that can flip hard if Monday starts red.
🔧 Options Trade Setup (for Monday–Wednesday):
Bearish Scenario (favored setup):
If TSLA opens weak or rejects $325–$327.50 area again, consider buying a PUT debit spread, such as 322p/310p or 320p/300p (July 3 expiry).
Target zone: $312, then $300 gamma flush.
Stop: reclaim of $331 with bullish momentum.
Bullish Scenario (lower probability):
If TSLA reclaims $330 and breaks trendline toward $335, consider a CALL debit spread like 335c/345c (Jul 3).
Target zone: $345–$350.
Cut if it falls back under $327.50.
📉 Intraday Technical Breakdown (1H Chart):
The price has confirmed a CHoCH + BOS combo, rejecting from supply and pushing below the rising trendline. Friday’s recovery attempt stalled right under that broken structure, and sellers took over late day.
The 1H chart is forming a bearish descending channel, with price currently trying to bounce off short-term demand, but failing to reclaim the key mid-zone.
This current setup favors continuation lower unless bulls can pull off a breakout early Monday. Otherwise, the path of least resistance is down.
📌 Key Levels to Watch:
$330.00 – Former GEX support, now resistance
$331.10 – Trendline and bearish trigger flip
$322.00 – Key support line (last defended Friday)
$320.00 – Gamma pivot zone
$310.00 – GEX magnet and low-volume shelf
$300.00 – Highest negative GEX and major PUT support zone
$345.25 – Upper trendline + prior supply rejection
✅ Thoughts and Monday Game Plan:
TSLA is sitting on the edge of a breakdown. The gamma structure supports further downside as long as price stays below $330. Watch for early rejection at $325–$327.50 to initiate puts.
If bulls manage to gap and reclaim above $331, reassess for a reversal setup — but for now, structure, volume, and GEX are all pointing down.
This is a reactive trade — wait for early confirmation on Monday and ride the wave, especially if SPY opens weak.
Disclaimer:
This analysis is for educational purposes only and not financial advice. Always trade with proper risk management and do your own due diligence.

TESLA CORRECTION ON THE WAY? + MY WATCHLIST FOR JULY 2025In this video, I run through a couple stocks that look very interesting going into Q3 2025, all stocks listed below!
NASDAQ:TSLA
NASDAQ:CELH
NYSE:EL
NYSE:NKE
NASDAQ:SOFI
AMEX:SPY
NASDAQ:QQQ
NASDAQ:AMD
NASDAQ:CAKE

$Tsla $350 looks promisingNASDAQ:TSLA $350 looks promising in the upcoming weeks.
AMEX:SPY NASDAQ:QQQ NFA
How We’ll Trade Earnings This Season Earnings season is almost here — and if you're with QS, you’re already holding the most powerful edge in the market.
Let me walk you through how QS trades earnings, why we built 💸earning-signal, and how you can use it most effectively this quarter.
---
📜 A Little History: The Birth of 💸earning-signal
When QS launched in early April, we started with just two short-term signals:
⏰0dte
📅weekly-options
Both focused on short-term options trades.
Then came TSLA earnings in late April. That’s when we launched our very first 💸earning-signal — and nailed the prediction.
Since then?
We’ve had one of the best earnings win streaks on the internet. Period.
📌 Don’t take my word for it — check:
#✅signal-recap for the track record
#🤑profits and #🤩member-testimonials for real wins from members
---
🤖 Why We Built a Separate Earnings Signal
Earnings are not regular trading days. The dynamics are completely different.
On normal days, a stock might move <1%
On earnings? 10–20% swings are common
This is what we call a “pivot event” — and it requires a different engine to predict.
That’s why we separated:
📅 #weekly-options → normal day-to-day setups
💸 #earning-signal → high-volatility earnings plays
---
🧠 How a Human Would Trade Earnings...
If you wanted to manually trade an earnings report, you’d need to analyze:
Past earnings reactions
Analyst expectations
Earnings call language
Financial statement surprises
Options IV & skew
Post-earnings stock behavior
This would take hours (or days) — and most retail traders don’t have time.
---
⚙️ How QS AI Does It Instead
We built 💸earning-signal to do all that work for you — and more.
✅ It pulls in all the data above
✅ Runs it through 5 top LLM models (each acts as an independent analyst)
✅ Aggregates their insights + calculates probability-weighted direction & strategy
✅ Uses fine-tuning to learn from its past prediction success/failures
This means: faster decisions, deeper insights, and better accuracy — every week.
We don’t just run predictions. We let the AI learn from past mistakes and self-improve each quarter.
---
💥 Results Speak for Themselves
Last season, we nailed:
TSLA
MSFT (10x–20x winners!)
NVDA
AAPL
And many more...
All based on this unique AI-driven earnings analysis stack.
This season?
We’re going harder, faster, and even smarter. 📈
🎯 The goal is clear:
Make 💸earning-signal the #1 earnings prediction system in the world.
---
🧩 Final Notes
Earnings are 10x harder to trade than regular days
But with QS, you’re equipped with 500x the speed and insight of an average trader
Upgrade if you haven’t yet: #💰upgrade-instructions
Earnings season kicks off next week
Let’s get it.
Let’s win big.
Let’s make season 2 of 💸earning-signal our most legendary yet. 🚀💸

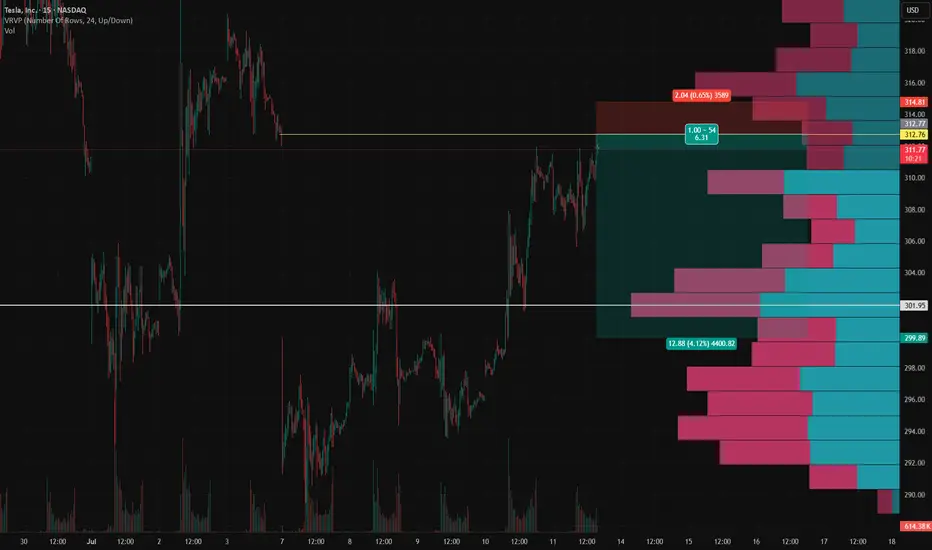
TSLA Short Setup – Fading the July 7 Gap FillTSLA Short Setup – Fading the July 7 Gap Fill 📉
This short idea on TSLA builds off a key gap fill from Monday, July 7 , combined with a strong local volume profile and risk-reward alignment on the 15-minute chart.
Entry: $312.76
Stop Loss: $314.81 (above gap resistance and local high)
Target: $299.89 (gap base and volume shelf)
RR: ~6.3R
Why I'm shorting here:
TSLA has just filled the July 7 gap , which often acts as a technical resistance zone on retest.
Price stalled right as it completed the fill — with visible hesitation and selling pressure stepping in.
VRVP shows low liquidity above, suggesting diminished reward for upside continuation.
Below, there's a clean volume shelf around $294–$300 that could attract price if weakness confirms.
Trade Logic:
This is a classic fade-the-gap-fill setup, targeting the lower edge of the volume cluster for a potential bounce or reversal zone.
As always: size accordingly, stick to the stop, and don’t chase if the entry’s already gone.
Thoughts? Anyone else watching this gap level?
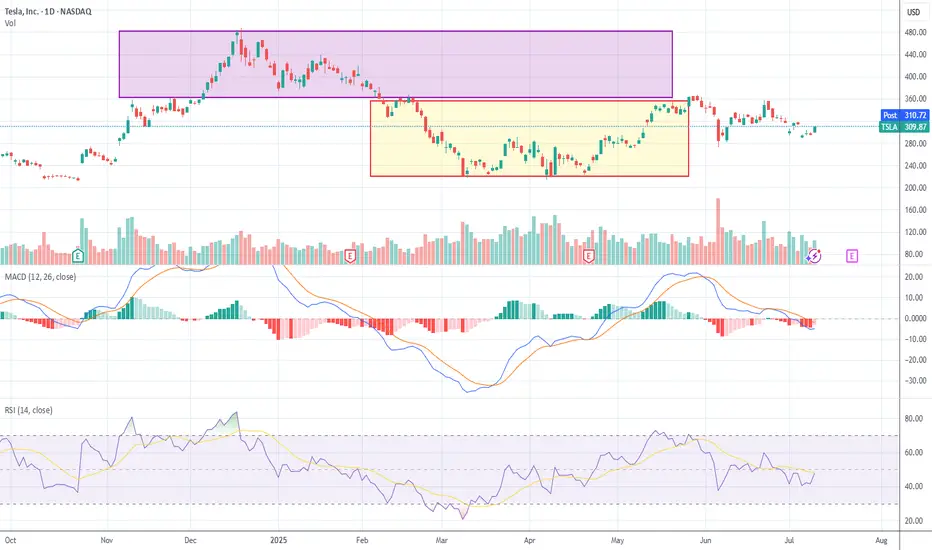
Tesla Flashes Bullish Reversal: Engulfing Candle and Volume PoinLet’s reassess TSLA now that we have this new candle (a big move +4.73%) in context. This changes things substantially, so I’ll reapply candlestick techniques, assess trend health, box positioning, and momentum.
Candlestick Analysis
The new candle:
Large white body (+4.7%) closing at $309.87. Engulfing prior 2 candles’ real bodies → this is a Bullish Engulfing Pattern. Occurs near the 50% retracement ($290) zone (previous support). Volume expanded vs prior days → adds validity. Bullish engulfing after a down leg is an early reversal signal.
Context:
This happens after weeks of indecision candles (spinning tops / dojis) → classic “coiling” behavior before expansion.
Trend Health & Momentum
MACD: Still below zero but histogram bars turning less negative → momentum starting to shift.
RSI: Up to ~47.6, breaking out of its down channel. A move >50 would confirm momentum pivot.
Box Dynamics
TSLA just punched through the upper edge of Box 2 ($300) with conviction.
Now entering “no man’s land” between Box 2 ($300–$360) and Box 1 ($360–$465).
For a sustained breakout it must close above $306–310 range for 2-3 days. Ideally see follow-through with a test of $328 (78.6% Fib).
Tactical Breakdown
✅ Breakout case (higher probability now):
Bullish Engulfing + volume expansion at support zone.
Closing above $306-310 increases odds of a run toward $328 (78.6%) and possibly $360.
❌ Reversal back down (lower probability):
Only if TSLA immediately rejects $310 and falls back below $300 in the next 1–2 sessions.
This price action looks like accumulation showing its hand. Large white candle suggests buyers absorbing supply at prior resistance.
Breakout above $306 confirmed if follow-through continues. Odds for a reversal lower just dropped sharply after today’s engulfing.
Tesla Share Price at Key Technical LevelTesla’s share price has returned to a well-established upward trendline. The key question now is: will this trendline act as support and trigger a bounce, or will it be breached, attracting further selling pressure and pushing the price lower?
We’d love to hear your thoughts — will the bulls defend this level, or are the bears gaining ground?
Stocks SPOT ACCOUNT: TESLA stocks buy trade with take profitStocks SPOT ACCOUNT: MARKETSCOM:TESLA stocks my buy trade with take profit.
Buy Stocks at 297 and Take Profit at 319.
This is my SPOT Accounts for Stocks Portfolio.
Trade shows my Buying and Take Profit Level.
Spot account doesn't need SL because its stocks buying account.

Tesla's Self-Inflicted Crisis of ConfidenceInvestors wanted Elon Musk to double down on EVs. Instead, they got a new political party and another reason to sell the stock.
Musk vs Trump: A Fight Investors Didn’t Ask For
Tesla’s latest sell-off has little to do with earnings or electric vehicles. Shares dropped 6.8% on Monday after Elon Musk announced plans to launch a new US political party, escalating his feud with Donald Trump and reigniting investor concerns about distraction at the top.
The fallout from Musk’s political re-entry has been swift. Tesla’s valuation has lost over $200 billion since late May, when Musk’s role in Trump’s short-lived government efficiency task force came to an end. His renewed focus on political activism contradicts April’s pledge to spend “far more” time on Tesla, and comes at a moment when the business is already under pressure from slowing EV sales and collapsing regulatory tailwinds.
Politics, Profits and a Shrinking Mandate
Trump’s so-called “big, beautiful bill” is slashing support for electric vehicles across the board. Gone is the $7,500 federal tax credit, set to expire in September. Gone too are the emissions penalties that allowed Tesla to bank billions in regulatory credits from legacy automakers. William Blair analysts estimate that over $2 billion in high-margin profit is now at risk.
The political clash is getting personal. Trump has mocked Musk’s behaviour as a “train wreck”, suggested deportation, and floated nationalising SpaceX. Investors, meanwhile, are left questioning whether Musk’s growing list of battles is starting to erode Tesla’s long-term advantage. The distraction risk is real, and the market is responding.
Technical Breakdown: Key Levels in Play
Tesla’s share price has woefully underperformed this year. The stock is down 22% year-to-date, while the S&P 500 is up 6%. Recent price action highlights just how vulnerable Tesla has become to the political whims of its CEO. The public fallout with Trump helped define a new swing high in May, which now acts as clear resistance. A new swing low was formed in early June, and that is now the short-term level bulls need to defend.
Adding Keltner Channels to the chart puts the recent volatility into perspective. The sideways bands and price bouncing between them show a market stuck in broad equilibrium. There’s little directional conviction, but that may be changing. Monday’s sell-off pushed Tesla below the volume-weighted average price anchored to the April lows. If the shares remain below this VWAP and break under the June swing lows, it would confirm the attempted recovery has failed and signal that the bears are back in control.
For now, Tesla isn’t trading like a high-growth innovator. It’s trading like a politically charged meme stock with no clear trend and no adult supervision.
Tesla (TSLA) Daily Candle Chart
Past performance is not a reliable indicator of future results
Disclaimer: This is for information and learning purposes only. The information provided does not constitute investment advice nor take into account the individual financial circumstances or objectives of any investor. Any information that may be provided relating to past performance is not a reliable indicator of future results or performance. Social media channels are not relevant for UK residents.
Spread bets and CFDs are complex instruments and come with a high risk of losing money rapidly due to leverage. 85.24% of retail investor accounts lose money when trading spread bets and CFDs with this provider. You should consider whether you understand how spread bets and CFDs work and whether you can afford to take the high risk of losing your money.

$TSLA hanging by a threadNASDAQ:TSLA getting rocked again today. Gapped down over 7% at open. Literally hanging by a thread on the bottom of the daily cloud. It's also OUTSIDE of the bottom Bollinger band...
Also otm call flow just came in $1.8 million 325c 7/25 @ 6.40

Better MACDWhat is the MACD?
The MACD (Moving Average Convergence Divergence) is a momentum and trend-following indicator. It’s based on the difference between two EMAs (Exponential Moving Averages) and helps spot:
Trend direction
Momentum shifts
Reversals
Entry/exit points
✅ Basic MACD Techniques
1. Signal Line Crossovers
Bullish Crossover: MACD line crosses above Signal → buy signal
Bearish Crossover: MACD line crosses below Signal → sell signal
🔸 Works best in trending environments, 200 SMA as a filter.
🔸 Combine with volume or trend filters for best results
2. Zero Line Crossovers
When MACD crosses above 0, the shorter EMA is above the longer EMA → bullish. This is typically the sign of a larger trend than crossovers.
When MACD crosses below 0, shorter EMA is below → bearish
🔸 Zero line = baseline momentum direction
🔸 Cross above = bullish trend confirmation
🔸 Cross below = bearish confirmation
3. Histogram Momentum
The histogram is often the first sign of a shift before a crossover happens.
Read it like this:
Histogram growing: Increasing momentum in that direction
Histogram shrinking: Momentum is fading
Histogram changing color (in many indicators): Potential reversal
🔸 Use histograms to get early signals, even before crossovers. Confirmed with volume surge and Price Action.
🔍 Advanced MACD Tricks
📉 4. Divergence Detection
Divergence occurs when price and MACD move in opposite directions.
🔸 Bullish Divergence:
Price makes lower lows
MACD makes higher lows
→ Hidden buying pressure, trend reversal likely
🔸 Bearish Divergence:
Price makes higher highs
MACD makes lower highs
→ Trend weakening, reversal likely
🔹 Confirm with:
RSI, when the lower timeframe RSI is oversold and the higher timeframe MACD is rising, then it's a good sign, and the opposite is true for bears.
Support/resistance zone: draw trendlines either on the volume or price and watch out for retests on the breakout.
Candlestick reversal patterns: some bearish patterns are bullish on indexes because of dollar cost averaging.

Long-Term Growth Potential in the Face of Short-Term ChallengesCurrent Price: $323.63
Direction: LONG
Targets:
- T1 = $331.50
- T2 = $345.00
Stop Levels:
- S1 = $319.50
- S2 = $310.00
**Wisdom of Professional Traders:**
This analysis synthesizes insights from thousands of professional traders and market experts, leveraging collective intelligence to pinpoint high-probability trade setups. The wisdom of crowds principle suggests that aggregated perspectives from experienced professionals build a more balanced outlook on Tesla, reducing emotional biases and highlighting consensus opportunities in the market.
**Key Insights:**
Tesla is currently navigating through a challenging phase characterized by competitive pressures in both China and Europe. Recent macroeconomic headwinds, including rising interest rates and shrinking global spending on electric vehicles, have fueled concerns about short-term sales performance. However, analysts remain optimistic about Tesla's innovation leadership, particularly in AI-driven robotics, battery technology, and autonomous mobility development. The recent technical charts reflect a narrowing wedge formation, and a breakout above $354.78 could confirm renewed bullish momentum, offering significant upside potential.
**Recent Performance:**
Over the past few weeks, Tesla has experienced tight price consolidation, underlying near-term indecision among market participants. While its stock price remains below short-term moving averages, signaling bearish pressure, longer-term sentiment is bolstered by overall optimism in the technology sector. Additionally, fluctuations in deliveries and revenue from various regions continue to impact day-to-day trading sentiment, with the stock showcasing higher volatility during earnings updates.
**Expert Analysis:**
Market analysts exhibit cautious optimism surrounding Tesla. Short-term concerns linger about declining sales growth in legacy markets such as Europe and the loss of its dominant position in China due to rising competition from local manufacturers like BYD. However, whether Tesla can monetize its cutting-edge developments in AI, robotics, and autonomous driving remains a focal point of its long-term strategy. Analysts agree that while these initiatives may redefine the EV market over the next 5-10 years, revenue realization is expected to be slow and could dampen speculative enthusiasm in the immediate term.
**News Impact:**
Tesla recently announced the launch of its robo-taxi initiative, beginning trials in Austin, Texas, a move that challenges traditional mobility norms. While this innovation enhances Tesla's narrative as a disruptor in the industry, regulatory obstacles and scalability issues pose immediate hurdles that could delay market adoption. On the downside, Tesla saw declining deliveries in Europe and China, casting shadows over its near-term growth prospects in these critical regions. Investors should keep a close eye on upcoming earnings reports for clearer guidance on production schedules and delivery forecasts.
**Trading Recommendation:**
Based on recent technical consolidation and consensus expert views, traders are recommended to take a long position on Tesla with price targets of $331.50 and $345.00. The stock exhibits signs of medium-term upside potential if momentum aligns with broader bullish trends in the S&P 500 and technology sectors. Implement disciplined risk management with stop levels set at $319.50 and $310.00 to protect against unfavorable moves. Investing in Tesla provides exposure to a high-risk innovation-driven narrative; traders should evaluate their appetite for risk carefully before entering this position.

super sell on the run for TSLAwe looking for sells on this pair as you can see there is a trend moving up but there is likly to have a short sells going on now

"Tesla: Accumulating Before Takeoff?"Tesla's acting weird, but to me, it looks like it's just loading up. Every time it hits that $320 zone, it bounces back hard. That’s not random — there’s volume, and it’s holding that level with respect.
If it breaks above $330 with solid volume, this thing could easily hit $356 or more. And with earnings coming up and all that robotaxi noise Elon keeps teasing… wouldn’t be surprised if it pops hard.
I’m not saying buy right now, but I’ve got my eyes on it. If I see confirmation, I’m jumping in with a long contract. Now, if it drops below $312 with conviction, I’m out — no hard feelings.
This could get real interesting. Stay sharp.
Safe Entry Zone TeslaGreen Zone is Safe Entry Zone.
Target is Take Profit line.
Note: 1- Potentional of Strong Buying Zone:
We have two scenarios must happen at The Mentioned Zone:
Scenarios One: strong buying volume with reversal Candle.
Scenarios Two: Fake Break-Out of The Buying Zone.
Both indicate buyers stepping in strongly. NEVER Join in unless one showed up.
2- How to Buy Stock:
On 15M TF when Marubozu Candle show up which indicate strong buyers stepping-in.
Buy on 0.5 Fibo Level of the Marubozu Candle, because price will always and always re-test the imbalance.

TSLA Long Trade Setup !📈 🚀
Price squeezing at triangle apex—breakout zone 📊
Entry: $327.38 ✅ | Stop: $322.18 🛑
Target: $344.14 🎯 — bullish pressure building! 🔼
#TSLA #LongTrade #TeslaStock #BreakoutSetup #TradingView #TechnicalAnalysis

Tesla (TSLA) -Bullish Reaccumulation Setup | Smart Money conceptTesla shows a clean CHoCH followed by BOS structure, indicating a potential bullish continuation. The market is forming equal lows into a demand zone (green box), suggesting a possible liquidity sweep before a move higher.
Key Technical Points:
CHoCH (Change of Character) confirmed on strong bullish impulse.
BOS (Break of Structure) signals market intent to continue upward.
Ascending triangle structure with multiple support tests (marked "S").
Anticipated sweep into demand zone: $308–$312 area.
Potential upside target: $365–$375 supply zone.
Bias: Bullish on confirmation of demand reaction.
Disclaimer:
This is not financial advice. Always do your own analysis before investing.

Tesla (TSLA) 1H Chart – Wyckoff Cycle in ActionThis chart reflects a textbook Wyckoff pattern unfolding on TSLA’s 1-hour timeframe:
🔹 Accumulation Phase observed early May
🔹 Followed by Manipulation & Distribution – classic trap before markdown
🔹 Sharp selloff led to another Accumulation zone around $305
🔹 Further manipulation wicks indicate smart money involvement
🔹 Now projecting a move towards $360–$370 distribution zone
📌 Structure breakdown:
Smart Money Accumulation ➡️ Manipulation ➡️ Distribution
Bullish momentum building from $306 support
Eyes on reaction near the marked green distribution box 📦
📅 As of June 15, 2025 – chart aligns with Wyckoff theory and institutional behavior.

V-Bottom + Apocalypse news => Going UpV bottom was formed.
News are clearly bearish in a conclusive way =>> fool the public to sell shares to the big fish while the market will go up...
Overall market sentiment under the hood is bullish. Public is in huge fear of banks that collapsed and will continue to collapse, so the masses will sell stocks on an up wave fearing it will go down.
How else you will make the mass public sell their stocks? if there is no apocalypse on the way...? think about it...


TSLA Short Setup Alert!Price rejected near resistance and forming lower highs.
Entry: $327.78 | Stop: $332.08
Target: $314.24 — watching for breakdown below support.
#TSLA #ShortTrade #TechnicalAnalysis #StockMarket #TradingSetup

TSLA Elliott Wave Analysis | Bullish Scenario UnfoldingThis chart presents a detailed Elliott Wave analysis on Tesla (TSLA) in the 4-hour timeframe.
The price structure from the April low suggests a completed corrective ABC pattern, forming a solid wave (4) base.
A new bullish impulse appears to be underway, with wave (1) and (2) of wave (5) already confirmed.
We are now tracking the development of wave (3), which has the potential to extend toward the 1.618 Fibonacci extension zone around $426, with intermediate resistance at $406.84 (1.414 Fib).
The projected wave (5) could complete near $440, marking the end of a larger degree 5-wave impulse structure.
Key levels to watch: support near $320.47 (0.5 retracement level of wave 1–3) and resistance at $360–380 before the next leg higher.
Two possible scenarios are outlined:
Primary Path (solid lines): Strong bullish continuation toward wave D and (5).
Alternate Path (dotted lines): Short-term correction back to the trendline support before resuming the uptrend.
The chart also highlights the breakout from a long-term descending trendline and a potential cup-and-handle continuation pattern, supporting the bullish thesis.
📈 Trade Plan: Watching for confirmation above $360 to target $406 and $426+ in the coming weeks. Stops should be considered below $310 depending on risk tolerance.
NFA
