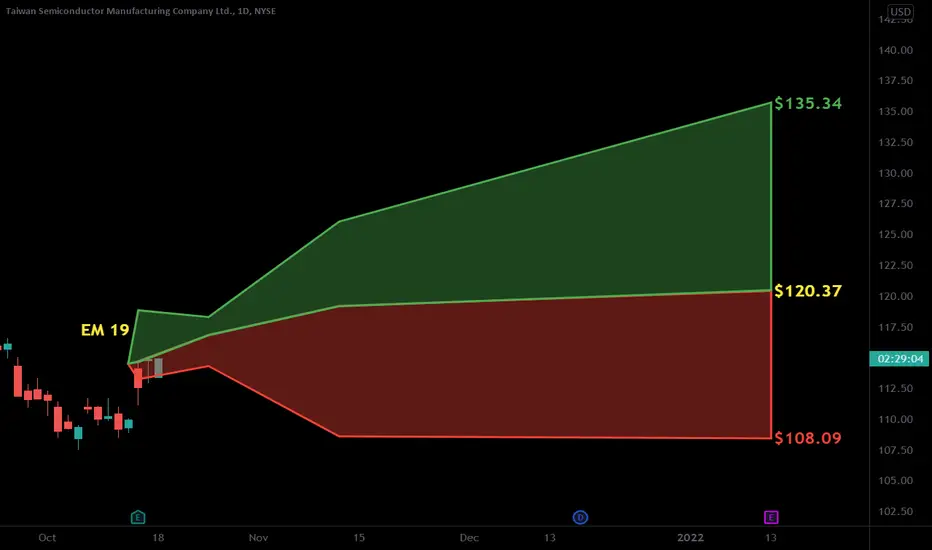
Long | TSM | Intraday play 11/05/2021NYSE:TSM
Possible Scenario: LONG
Evidence: Price Action , Dark pool activity, Options flow.
Entry point: current price, it can drop more but not important.
TP: 120$
Call options, Strike 32.5$, 12/03/2021, this is the cheapest call options with 40% discount on premium, when it hit TP you should be in 100% profit. GL
*This is my idea and could be wrong 100%
TSMC34 trade ideas

TSMMy TSM trade plan. Entries marked by green arrows, will mostly likely have a third and final entry upon break of this trading range.

$TSM setting up post earnings...Sitting mid-range, and needs to push through this vwap, but next week $120's at $0.24 are low risk, potential high rewards if we move tomorrow and early week...

TSM - STOCKS - 25. OCT. 2021Welcome to our Weekly V2-Trade Setup ( TSM ) !
-
4 HOUR
Small bearish turnover..
DAILY
Expecting more bullish pa!
WEEKLY
Great long setup..
-
STOCK SETUP
BUY TSM
ENTRY LEVEL @ 114.06
SL @ 112.45
TP @ Open
Max Risk: 0.5% - 1%!
(Remember to add a few pips to all levels - different Brokers!)
Leave us a comment or like to keep our content for free and alive.
Have a great week everyone!
ALAN

TSM looking bullish off earningsTSM been bullish off earnings and consolidating all year in the 107-125 range. Larger POC @ ~117.8. Ideal buy zone $112.75-114.25. $122.5 next target. OBVM trends starting to bottom here. I started a small position at 115, looking for support here.

$TSM with a Bullish outlook following its earnings #Stocks The PEAD projected a Bullish outlook for $TSM after a Negative over reaction following its earnings release placing the stock in drift C with an expected accuracy of 100%.
If you would like to see the Drift for another stock please message us. Also click on the Like Button if this was useful and follow us or join us.
High inflation Please don't playing politics and please career about people live of life quality...before doing wrong job people,l.. Things how to change people life quality, heardcare, and,education, i hope people country open your mind..what u identify real...if u stop, i Will long team forecast in country

$TSM earnings anticipation play...Close your eyes and imagine a scenario where TSM pushes up 3% into earnings...in that example, we are sitting at about $115 and the same week calls going for $0.62 are likely closer to $1.70/$1.80 right before earnings. Then you sell and don't play earnings...that's my example, going to take a shot

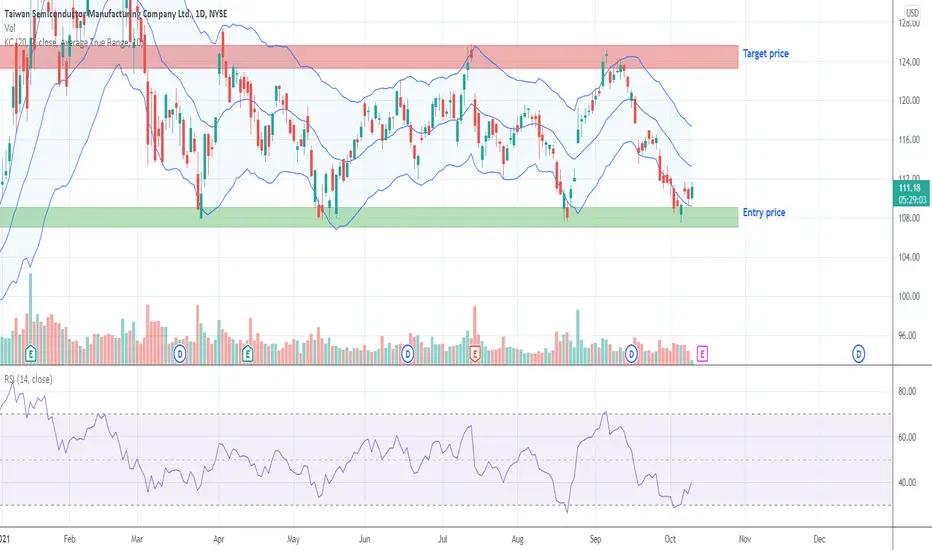
TSM longEntry price: 107-109$
Target price: 123-126$
Keltner Channels: The price is oscillating close to the lower boundary.
RSI: Approaching 30 level, thus asset is close to being oversold.
Conclusions: The price just bounced the strong support level. Moreover, among Keltner Channels and RSI the price increase will occur soon. Therefore the long position is recommended after the price will reach the support zone again.
No financial advice.
$TSM Trade the ChannelTSMC is a nice Iron Condor Setup looking back :)
I like credit spreads here or can try naked calls to ride the channel up . Earnings upcoming so a better idea may be to sell puts and capture the IV crush after.
Regardless, TSM has been in the 107-125 range since March and you can trade it as such until we see a bigger box breakout either up or down.
I took the 11/19 110/105P for 1.88 avg

$TSM looking for a move into earnings...I don't play earnings, but I do play anticipation into earnings. Should get some increase volatility and hopefully a move up in anticipation of earnings next week. Next week $115 calls at $0.60 seems like a solid risk/reward. Credit to @utlonghorn for the idea on the chart (not the call option)

Khan's Chart-Requests 20 - $TSMFilled the Gap, now EMA200 remain as hard resistance. Would like to see a strong push through and then it could provide a new support.
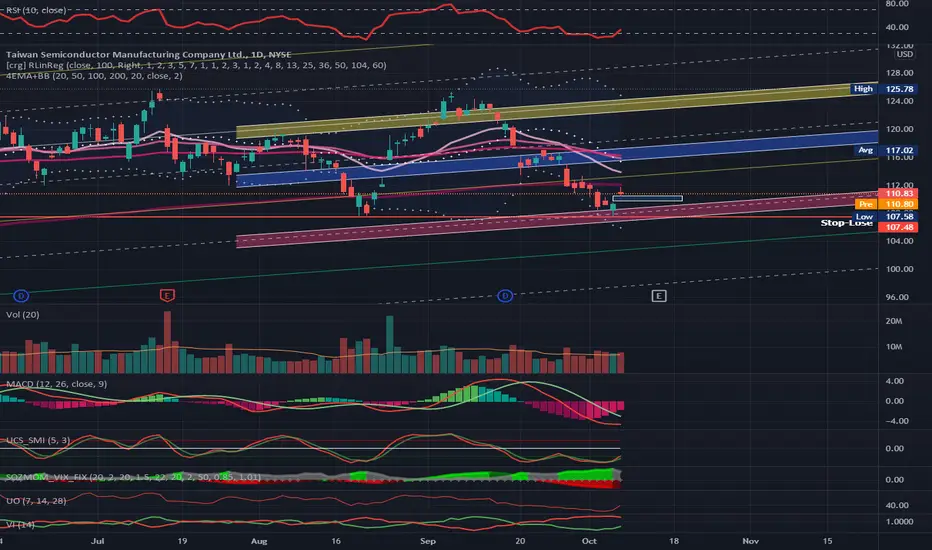

Technical analysis (TSM)Limit buy - 110,0$
Target - 120,90
Risk/Reward Ratio - 3,63
Stop-loss - 107,0

TCM10.14 earning day. This company have high quality and maybe earning is growing up quickly nowadays.


$TSM at SupportWith an Excellent risk/reward, here's a play that has made some money for me in the past.
TSM at legendary support and RSI oversold 3:1 risk-reward.

$TSM Right back to critical horizontal supportThe chart is as clear as it gets, $108 is the big level here and it seems to be holding for now. Another bounce to $124-$126 resistance coming?

#TSM mid term AnalysisAs we all know TSM has amazing fundamentals, incredible advantages in their business model and benefitial political terms inside their country, right now their competitors are not close enough to compete with them at full scale. So we are not going to argue about value for this company. Not all day we have infront of us a company that represents value for half of the world chips manufacturer market.
since the July spike the price of #TSM has been trading at a side chanel from 108 usd to 125 usd, in case of a breaking of the 125 resistance at the edge of the accumulation channel, we can expect the price to travel smoothly to a) level target and so on, but in case of breaking the 108 support level we may see bears will take control to the oranges mark supports.
As expected due the economic enviroment right now, lets expect a lot of volatility but thats ok, dont forget you are sitting on a value stock, the stop loss is stretched due volatility.

TSM - Swing TradingChart Setups:
- hourly timeframe
- using my script "Relative Volume + ATR Strategy" to plot out significant price areas, assume they are areas of support/resistance (Orange lines)
Bias: Long. However, expects price rejection at 120. If the breaks out of 120, then at most it will re-test 126 before coming back down to one of those orange lines.
Analysts having been putting 130-150 targets on TSM, but this stocks always get sold off during first hours of opens. When looking from daily chart, this stock trades sideways. So instead of HODL'ing, a swing trader may see this as an opportunity for periodically selling an existing position (or shorting), followed by re-entering the trade (or covering).
Execution / Trade Journal:
I averaged down on TSM over the past week. My average cost was 112 on the day that the stock gapped up to 115.6. Sold off a portion of my holdings during the first hour of market's opening to adjust the weights of my portfolio.
Currently, I still hold half the number of shares acquired. Replicating the trailing stop-loss set by the strategy (refer to the plotted green line) with a stop-limit order, I manually adjust the stop-loss-price upwards whenever I notice price traded at a new high. My current stop-loss is at 117. If stopped out (while still taking profits), then I will re-enter the trade at a price ideally lower than the triggered stop-loss-price.

TSM to breakout from consolidation soon?TSM have been consolidating in the rectangle since March with several attempts to break the $125 resistance. But with US market looks very likely for correction will TSM finally be able to break the $125 resistance? Let's find out soon


$TSM watch for break of channelTSM on the weekly has recently formed a triple bottom, trading the channel. MACD looks ready to cross and a close above AVWAP, watch for a breakout here.
10/15 $125c or 130/125 debit spreads as an idea to play the breakout.
Rejection of top of channels invalidates trade.
