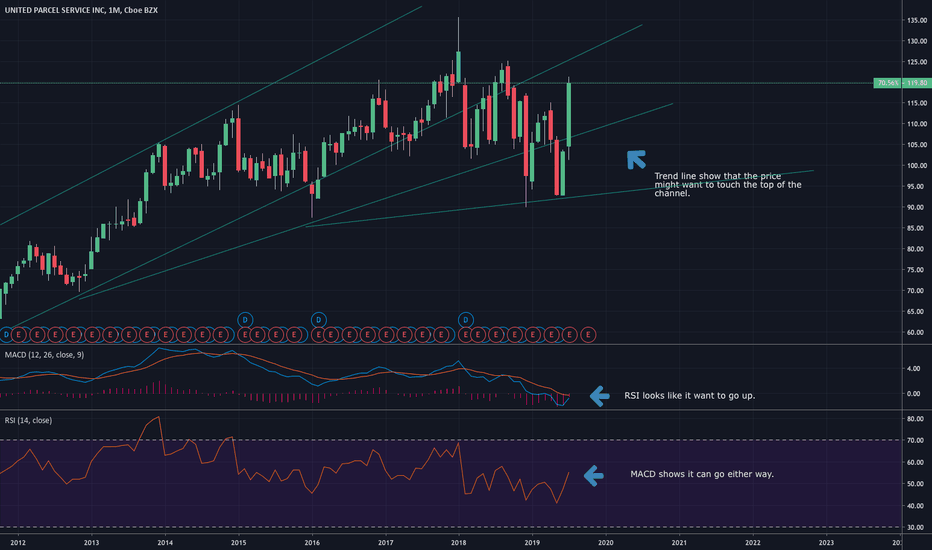
UPSS34 trade ideas
$UPS Monday trade in UPSEntry level $120.50 = Target price $135.00 = $stop loss $114.50
Bullish fundamentals post earnings.
Average price target $126 | Overweight.
P/E ratio 20.8
Yield 3.7%
Company profile
United Parcel Service, Inc. operates as a logistics and package delivery company providing supply chain management services. Its logistics services include transportation, distribution, contract logistics, ground freight, ocean freight, air freight, customs brokerage, insurance, and financing. The company operates through the following segments: U.S. Domestic Package, International Package, and Supply Chain and Freight. The U.S. Domestic Package segment offers a full spectrum of U.S. domestic guaranteed ground and air package transportation services. The International Package segment includes small package operations in Europe, Asia-Pacific, Canada and Latin America, Indian sub-continent, and the Middle East and Africa. The Supply Chain and Freight segment offers transportation, distribution, and international trade and brokerage services. The company was founded by James E. Casey and Claude Ryan on August 28, 1907 and is headquartered in Atlanta, GA.
Your Parcel may be delayedUnited Parcel may be entering into a phase of correction as the signs are aligned for the bears.
First up, the long legged doji at the supply zone is a sign. Sellers may be kicking in in large numbers tonight.
Rising Wedge formation.
Potential overbought crossing
The buying gap is still hollow, perhaps price may stage a strong rebound there.
Bullish S/R flip and DMA Golden Cross on UPS.UPS is currently building support on top of old resistance around $112 (which confirms the bullish support and resistance flip), and is consolidating in what looks to be a bull flag-like pattern. We also have a daily golden cross (50 day moving average crossing the 200 day moving average) and we could see the momentum continue to carry this stock higher. R/R is pretty good here, but I've had what I thought were good setups turn south pretty quickly (EA and SQ for example), so be cautious and use proper risk management if you decide to take this trade.
Moving average guide (All daily for this post):
50 day moving average in Green.
100 day moving average in Yellow.
200 day moving average in Red.
Entry: 112.30-114.50
Target 1: 118.00
Target 2: 120.60
Target 3: 125.00
SL: 110.50 (below the 50 and 200 day moving averages, and below our support zone at 112.)
-This is not financial advice. Always do your own research and own due-diligence before investing and trading, as for investing and trading comes with high amounts of risk. I am not liable for any incurred losses or financial distress.


