WIX bull flag still gaining tractionWIX came out with knock out earnings and formed a clear bull flag on the daily charts. The buy point on WIX for me is 354. I was triggered into the trade last Friday but the pattern still looks good and is still making higher lows. IF volume can push this name higher the first level of profit taking is around 365.
The level of consistency for bull flags increases if that bull flag was formed from earnings. meaning if you get a earning bull flag the trade is more to continue higher.
W1IX34 trade ideas


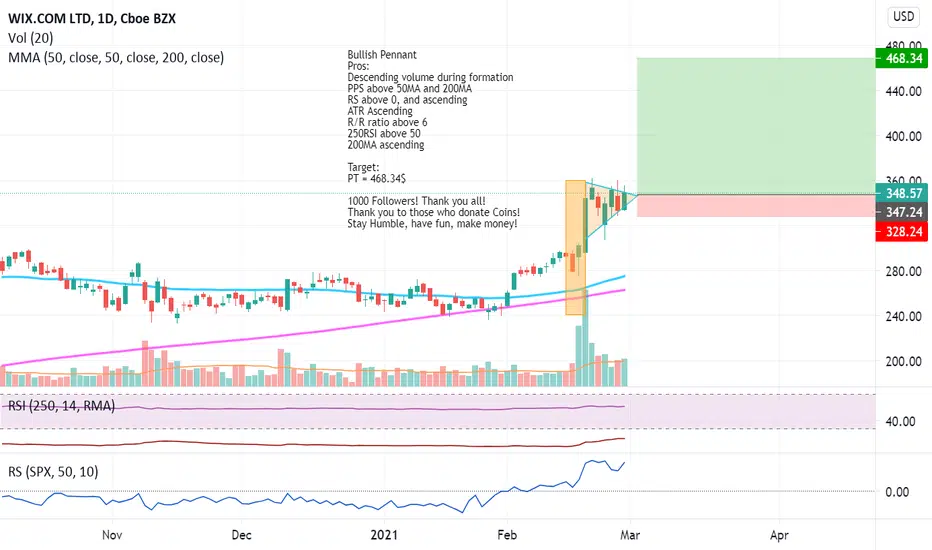
WIX: Bullish PennantBullish Pennant
Pros:
Descending volume during formation
PPS above 50MA and 200MA
RS above 0, and ascending
ATR Ascending
R/R ratio above 6
250RSI above 50
200MA ascending
Target:
PT = 468.34$
1000 Followers! Thank you all!
Thank you to those who donate Coins!
Stay Humble, have fun, make money!
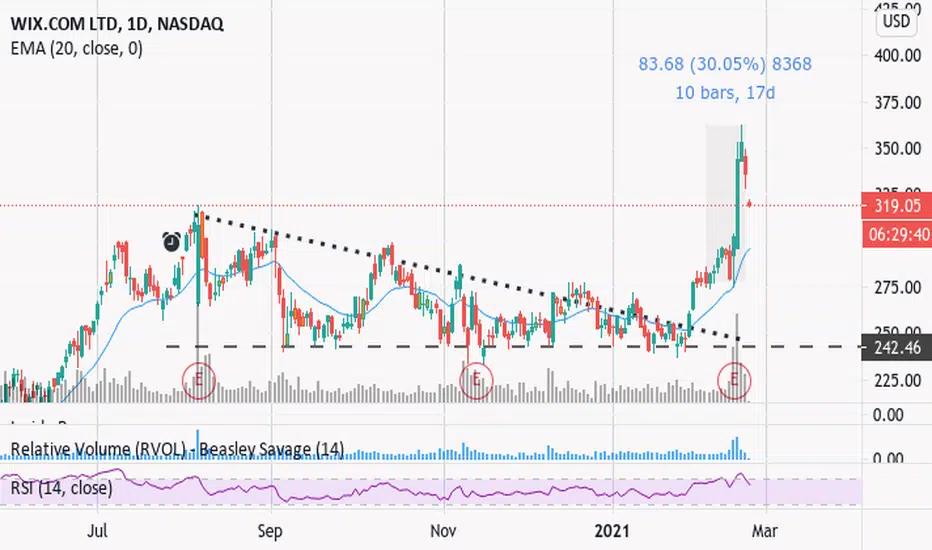
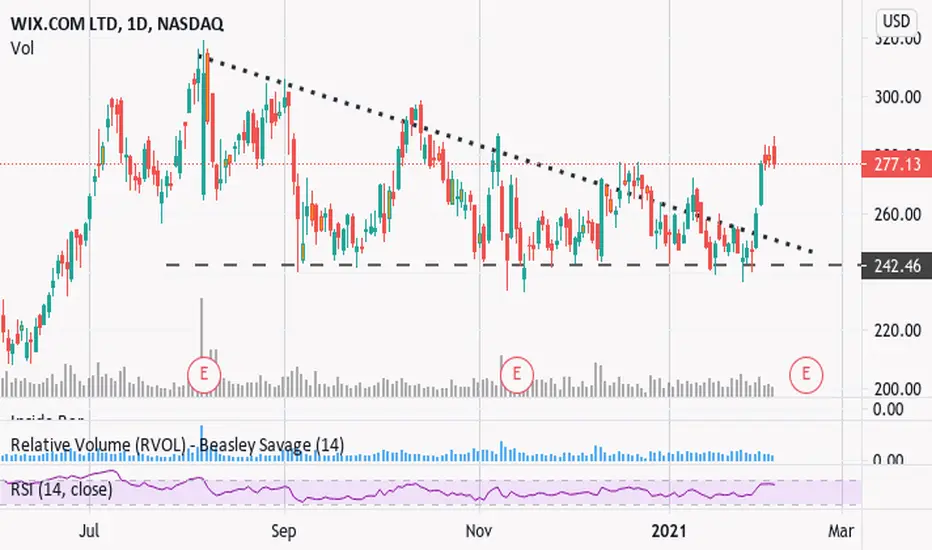
Explosive move on $WIX +30% move with earning day .Daily descending triangle is a good pattern you should learn how to trade it.
It's very profitable and authentic pattern that rarely fails .
It looks higher too but honestly , the market condition is not good "currently " for a long sentiment .
Wix to $404 before Feb 23Wix new price target: $ 404
When: Before Feb 23
Growth: 14.7 %
Buy: YES
There is no clear bottom here, but the Stoch is showing some strength signal, if this is the bottom, then expect these results to happen...
Trade at your own risks

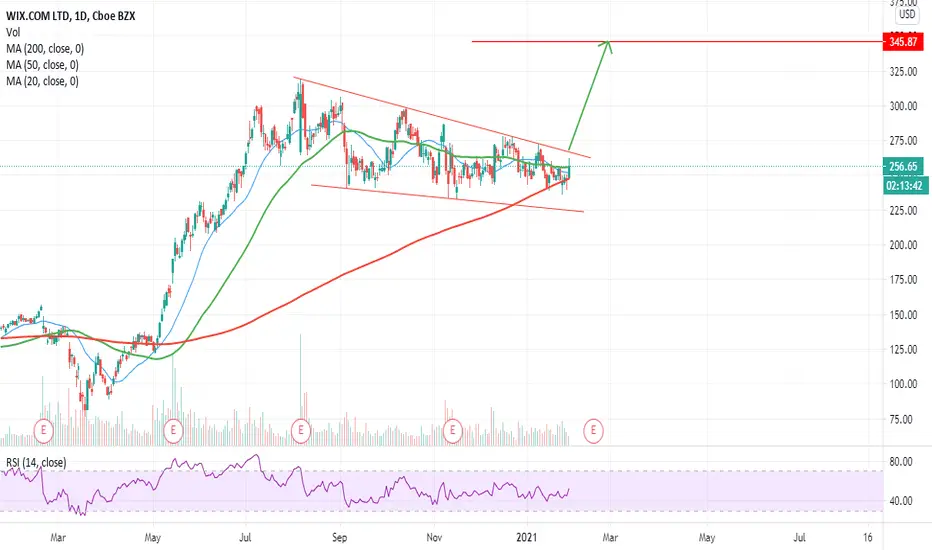
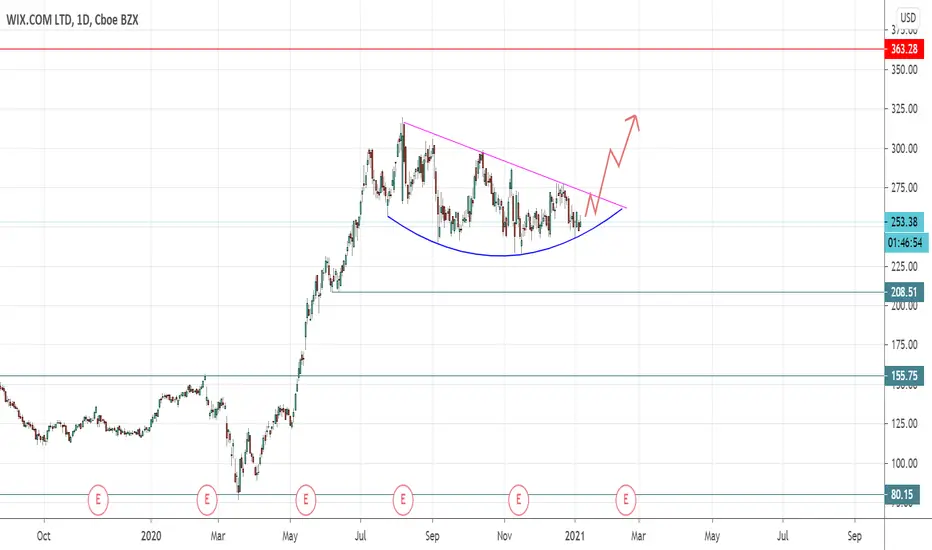
WIX is looking amazing and is about to break outNASDAQ:WIX has been consolidating since few months in a perfect falling wedge continuation pattern and bounced nicely of the 200 MA. Break out of the falling wedge is expected to generate considerable gains. Long the break out to target 345$, stop level at 220$. Long term target is above 450$.
Hit the like button and follow if you find this useful :)
This is only my own view and not financial advice, do your own analysis before buying or selling
Happy Trading!
200 % WixAs we see on the stock shart the price increases with a heap of 200% this time it will not go out of the rule pushed by a very strong action price

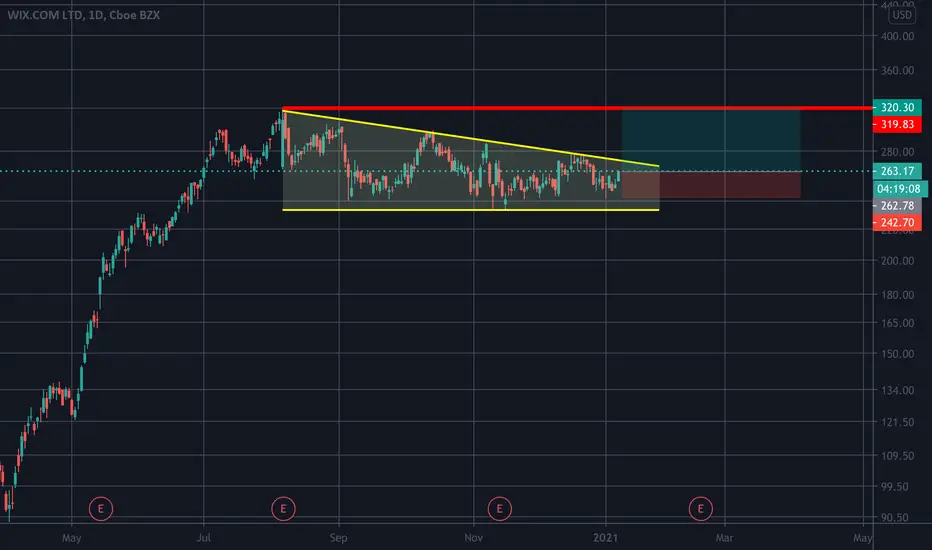
Breakout from consolidationWIX is looking really good here with a strong breakout through the 300 level backed by volume and bouncing from the major Daily MA's in what appears to be a trend continuation pattern.
There are some proper targets with the Yearly R1 pivot @ 353 and the Yearly R2 pivot @ 457

$WIX TK CROSS Price target $360Lagging span over price action
TK cross coming out of months long consolidation
Price target $360

WIX is going for a ride (Daily descending triangle)$WIX has successfully broke the descending triangle and heads higher .
Please note we have the earning day ahead .
#Trade_safe and keep learning until you succeed .
No matter what you said about the Stock-market , it is the biggest meritocracy in the world.
WIX tells Bearish StoriesWIX Performed well in the last 5 years, and shows a strong bullish move.
Daily Chart - The Whole Picture (Line):
Since March 2020, WIX Moved rapidly from Trading zone 1, to Trading Zone 2, by single print move:
The Buyers took the price up into New Trading Zone which shows signs of weakness - clear picture of Supply expansion.
When reached the new zone, WIX formed a proper Head and Shoulders Pattern, which failed to keep the Neckline clean, and therfore, became unreliable.
The former Pattern, evolved into Descending Triangle - Reversal Pattern with Major Trend implications - Which looks very promising.
Descending Traingle Requirments :
- 2 falling Tops, 2 Flat Bottoms.
- The pattern should arrive after Major Bullish trend.
- The Breakout should be in a range between 50%-75% of the overall Triangle - The Vertical Yellow Line Represents the 75% border.
- The Breakout should be with Low Volume , High Volume Breakout would probably take the price back to the Demand Line (Support).
Potential Move:
- The Minimum Potential move is equal to the vertical range between the first Top of the traingle to the Demand Line (Support) Pasted from the Demand line downward.
In our case, the Minimum Potential is 168.76 (The Dashed Green Line):
- The Breakout move should be with the same behavior as the last bullish move before the triangle, in the case of WIX - Vertical Move:
Moreover, by streching Fixed Range Volume Profile, we can see the Low Volume Zone clearly:
The Stock does not like to be traded inside the mentioned zone. Therefore, the price is expected to slide on this zone like Butter on Hot stone.
Conclusion:
While the overall market, and especially the Tech Sector, is on unrational euphoric Bullish state - WIX shows very promisng weakness signals, and the picture is completly bearish.
Understand: The Indexes are nothing but a mix of stocks. Thus, by finding such strong stocks with a strong weakness signals, we have to be even more cautious about the expected continuation of the Bull Market.
By digging into to indexes we can find the dirty stocks which might pull the market down in the future.
Entery Signal:
Low volume brakeout which make a distance of at least 3% from the Demand line Price.
If the breakout will occur with high volume, a retest might be expected.
Determine Good Stop Loss point, and take responsibility on your position.
Good Luck!

Update - Scaling in Wix Good pull back. Scaling in call debit spreads with 2-3 weeks expiration dates. Spread values will be $60 for $500 margin.

Weekly Outlook! $AMD $ATVI $UNH $WIX $LULU $FB $EBAY $HD + more!Today i go over some market patterns I am keeping an eye on for the coming week as well as going over the results of last weeks video!

Bullish on WIX, with close Stop-loss for tradingOnce again WIX is on it's support line. with earnings report coming soon, WIX is about to move up again.
Current support line, offers close stop-loss in case the stock drops.
the Win-lose rate is in bull side favor.

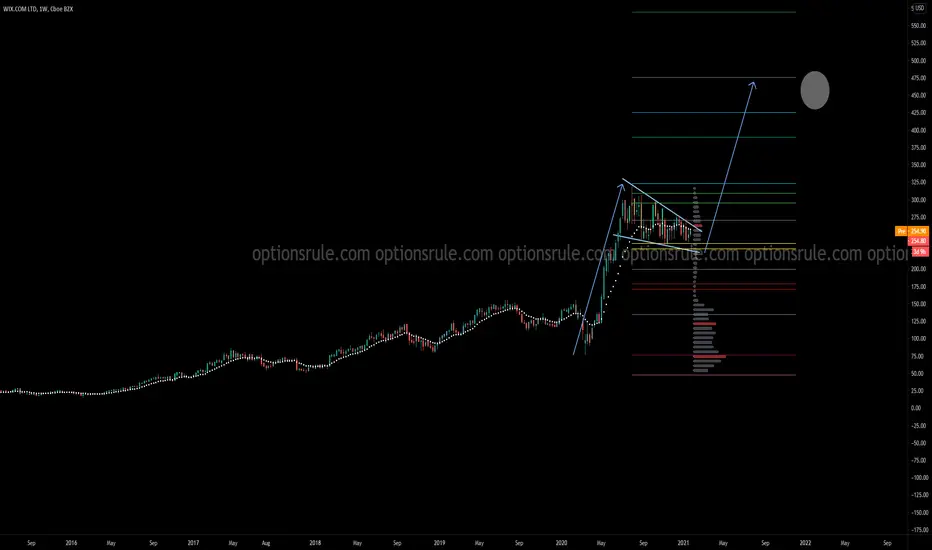
Wix - Great SetupI like the way this one is setting up. Rounded bottom.
Could go a lot higher over the next year.
Thank you
WIX: BREAK OUT PLAYI'm watching WIX as it could break that down trend line any time.
I'll feel confident for an entry if we clear 273-274 (based on Ichimoku daily).
All price levels are on the chart (in blue).
Price is supported by a long term trend line and a rising 200 MA which is not far below.


WIX support holds!The high level of demand for Wix's solutions and the resulting rapid revenue growth are impressive, but so is the strong cash flow the tech company is generating. The company currently expects total 2020 free cash flow to be between $122 to $127 million.
Zooming out over the past five years, Wix's annual free cash flow has risen from $14 million in 2015 to $127 million in 2019. It wouldn't be surprising to see this important profitability metric continue improving rapidly.
