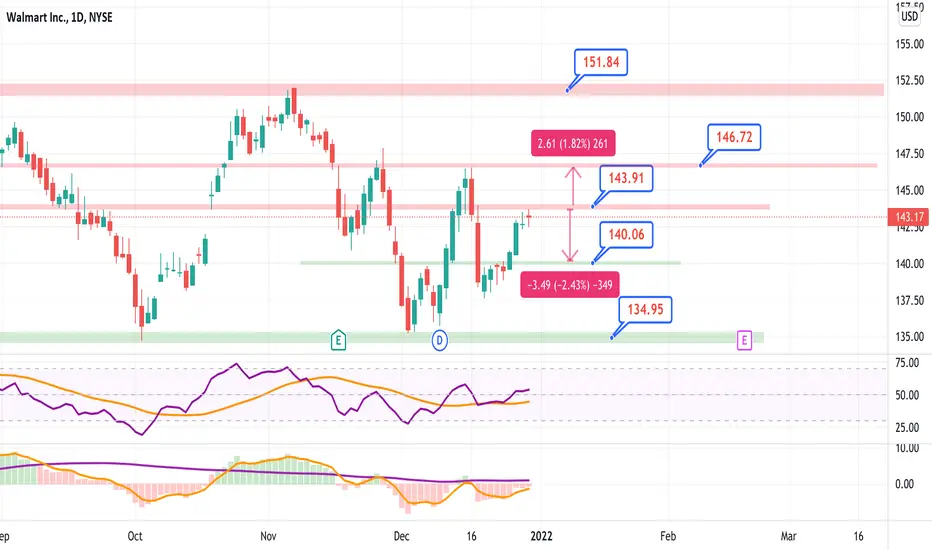
WMTWMT sitting right at resistance which is also the golden pocket. There is a chance for a retracement before it makes the next leg up. If it breaks resistance it will be an easy run to 146. If it decides to retrace you can find support at 140 and then 134.
WALM34 trade ideas
wmt buyWMT buy .. buy after the break above the resistance level and 200ma at 143.62 .. target point next resistance level 150.57 ..

WMT beginning a Trend UpThis one floated in yesterday morning while attempting to quiet my brain.
It is actually having a good day today, and the guidance is that it could really get going tomorrow (Wed.)
I suspect it'll drop a bit later today, or maybe gap down (small) in the morning and you buy it.
I'm looking for a move up to around $157 topping around Jan. 6th .
Obviously, there could be a larger uptrend, but my work is typically shorter term swings.


"Save Money, Live Better"Walmart forming an Ascending Triangle on the 1 hour, extremely bullish on it if the market can maintain a stable direction. Most likely buying some calls.

Bear Flag alert, January shortPretty Textbook bear flag approaching the resistance line. I'm banking on a breakdown rather than bounce off since there is such little volume. Jan puts

WMT Ascending Triangle tradeMassive ascending triangle forming. You don't want to miss out on this one
I would wait for a few more days to see if it is following the pattern. If it stays in the pattern until mid-late January, it will breakout hard to at least $150 if not even higher.
Just keep watching the chart. Don't act on emotions, don't act recklessly, don't be rash. I am personally going to buy calls if the pattern holds until Jan 20.
This is not financial advice, I am not an investment advisor, these are just patterns I see.

$WMT - Inverse Head & Shoulder Potential right shoulder forming Looking like inverse head and shoulder is forming. Right shoulder is yet to be completed.
If the price break above neck line price of $146, we could get to $158!
Target 1 - $158
Target 2 - $176
Neck line - $146
Risk - Falls below $139 and failure to break above $146
———————————————————
How to read my charts?
- Matching color trend lines shows the pattern. Sometimes a chart can have multiple patterns. Each pattern will have matching color trend lines.
- The yellow horizontal lines shows support and resistance areas.
- Fib lines also shows support and resistance areas.
- The dotted white lines shows price projection for breakout or breakdown target.
Disclaimer: Do your own DD. Not an investment advice.


WMT LONGRSI is up, good volume, tis the Season, I went out to 12/31 bought 144 calls at 3:00 pm they are cheap due to Market conditions.

WMT (Walmart, Inc.) Is BullishWMT (Walmart) Price closed above EMA 10, EMA 20, and Horizontal Support Resistance Level.

$WMT possible bullish continuation $WMT sitting just above the ema line. looking for possible uptrend continuation tomorrow. buy above 144.90 sell below 141.28

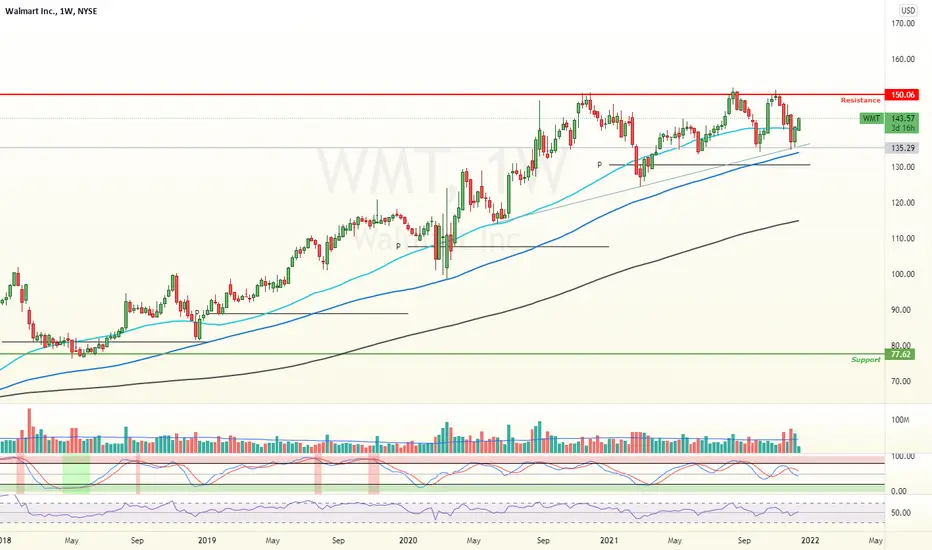
WALMART - Trend still intact- $WMT continues to find support at the $135 level
- Big resistance at $150
- Longer term trend is still intact to the upside
- Inflation proof stock
[stock] Walmart - WMT - What do you think?Walmart - WMT - What do you think about these 3 daily candles? Just asking? Edutainment Purposes Only?

RectangleWMT appears to have formed 2 bottoms and the bottom of the rectangle, and close to a third bottom at that level. For now the bulls have made a stand here.
WMT is meeting resistance right now. If the support of the bottom trendline holds in the rectangle, then WMT should at least make a run to the upside.
Rectangles are horizontal trading channels and are neutral. Some do swing trade inside of the rectangle boundaries but rectangles do eventually break one way or the other eventually.
Possible stop under the bottom trendline of the rectangle.
WMT has had 5 touches so far.
No recommendation.


The bottom of WalmartIm bullish walmart, it seems to go through these types of cycles.
Also, the worst expectation from analysts for this firm is 135 -- where its at.


WMT idea #1WMT at prior support and -2 std deviation of regression channel starting Jun '19.
Wanna be long targeting ATH, scaling out/re-entering bullish action along the way.

Walmart stock, Long !Hello traders, welcome back.
I think Walmart is in demand zone, last daily candle kinda proved that we are going to go back up.
My setup would be :
Entry price : 138.57
Stop loss : 133.80 ( At least )
Take profits :
- 1 : 151$
- 2 : hold if it broke the ATH resistance zone
* This is not a financial advice *
Good luck

Walmart Quasimodo Long Call Idea 📈long call idea on walmart as noted on chart strike entry is 136 with two stop out levels. if you feel like this chart idea has helped you in any way leave a like and follow for similar ideas like this one 👍
