ES Futures — Week Ahead Playbook (Aug 11–15)Macro Drivers to Watch
Tue Aug 12 @ 8:30 AM ET — CPI (July)
Key inflation print; expect sharp vol expansion in NY AM.
Wed Aug 13 @ 2:00 PM ET — FOMC Minutes
Insight into Fed’s July 29–30 meeting tone.
Fri Aug 15 @ 8:30 AM ET — PPI (July) + Retail Sales (July)
Two high-impact releases within minute
Related futures
Nasdaq’s All Time HighsLiquidity moves liquidity.
Expansion, Retracement, Reversal, Consolidation
Market is doing 1 of these 4
Expansion is determined by where liquidity sits and where it is going. Price delivery is upmost important when receiving bias and narrative
Seeing where price is coming from is just as importan
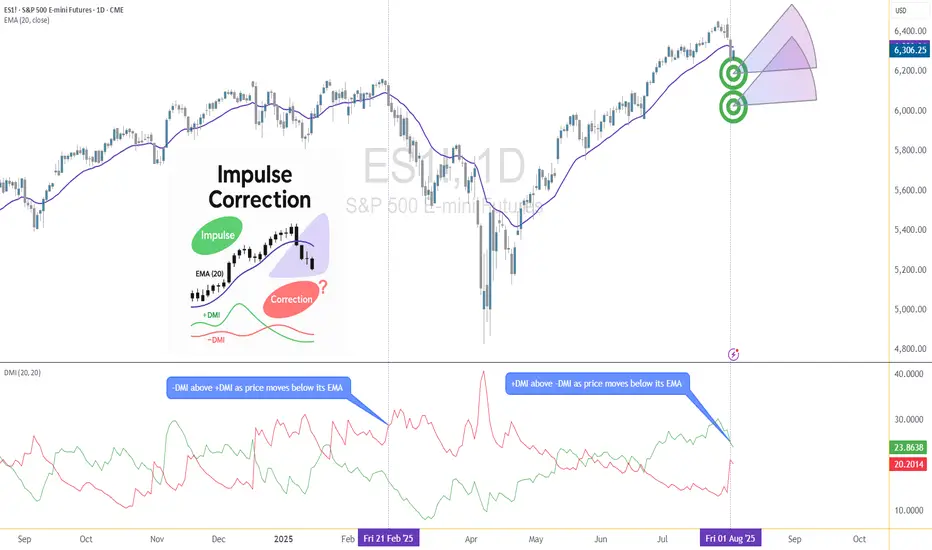
SPY The Final Countdown Since the April lows, equity markets have exhibited strong performance, with many stocks appreciating by nearly 100%—some even exceeding that threshold. Given the velocity of this rally, a corrective pullback may be imminent before the broader uptrend resumes.
The current reading on the Fear & Gree
AMP Futures - Heikin Ashi meets bar Replay!In this idea we will demonstrate how to access the NEW Heikin Ashi bar replay feature in Tradingview.

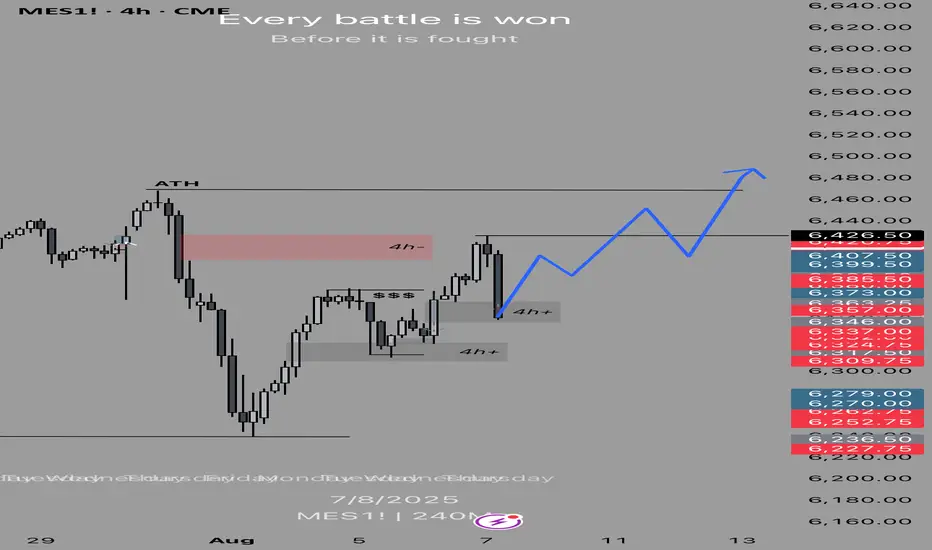
ES Fails to Break ATH – Possible Reversal Ahead?
The S&P 500 futures (ES) made another attempt at the all-time high but failed to push through. This rejection at resistance could signal potential exhaustion from buyers.
Key points I’m watching:
Strong rejection at ATH zone.
Momentum slowing on shorter timeframes.
Increased selling pressure

Day 3 — Trading Only S&P 500 FuturesDay 3 — Trading Only S&P Futures
Daily P/L: -142.87
Sleep: 7 hours
Emotions: Headache & stress from the morning
:thought_balloon: Today’s Trade thoughts:
I made a typo when i was putting some orders in from last night that triggered and started the day -300 so I spent most of today just grinding i

Day 7 Trading Only S&P Futures — Trusting Structure Over GreedWelcome to Day 7 of Trading Only S&P Futures!
Today was a mixed day with a small loss of -$16.65. I started strong, up $133 early on, but after a big push up, I expected the market structure to flip bearish and missed a key long entry. Later, I shorted the 6451 resistance but let greed get the best

Day 2 — Trading Only S&P Futures — -$100, Grinding Back from Los Day 2 — Trading Only S&P Futures
Daily P/L: -100
Sleep: 8 hours
Emotions: Good
:thought_balloon: Today’s Trade thoughts:
I rushed into a trade thinking 6330 was going to be a good area of support to buy and oversized my position going 5 mes deep in my first trade and adding 5 more at the 48 min M

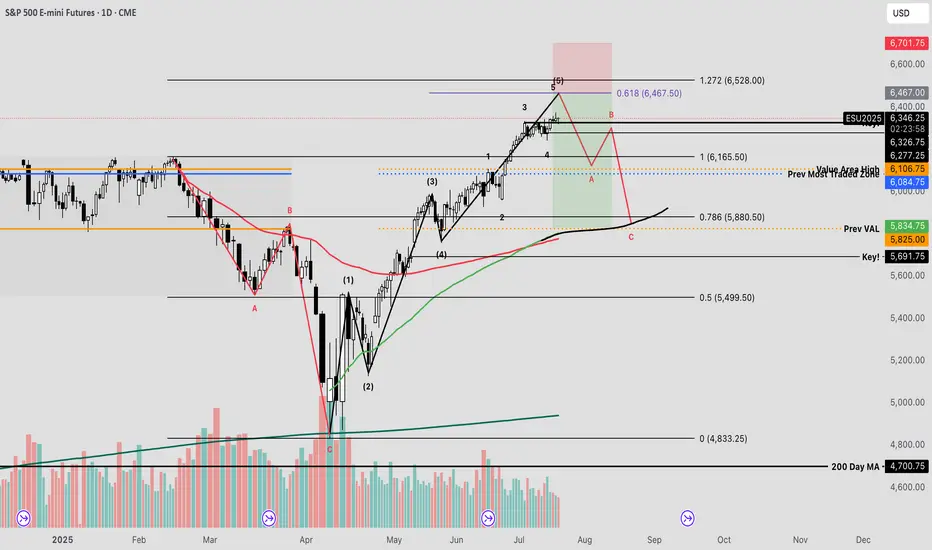
Corrective Dip or New Downtrend on the S&P 500 Futures?🟣 1. Impulses vs. Corrections – The Classical View
When price trends, it doesn't move in a straight line. Instead, it alternates between directional movements called impulses and counter-directional pauses or retracements known as corrections. Most analysts define an impulse as a sharp, dominant m
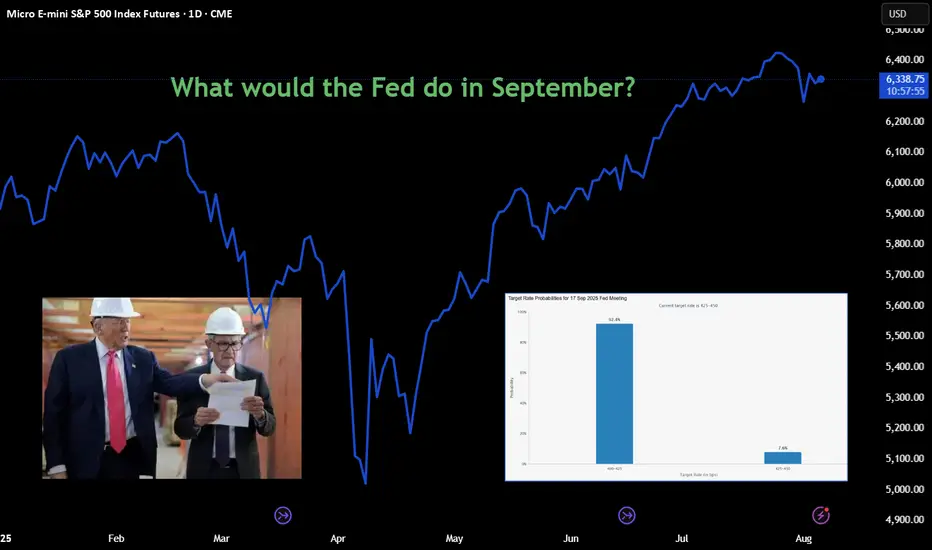
Approachable Contracts for Trading Around Fed DecisionsCME Group E-Mini S&P Options ( CME_MINI:ES1! ) and Micro S&P Futures ( CME_MINI:MES1! ), #microfutures
On July 30th, the Federal Open Market Committee (FOMC) decided to keep the Fed Funds rate unchanged at the 4.25-4.50% target range. Investors now turn their focus on whether the Fed will cut rates
See all ideas
Summarizing what the indicators are suggesting.
Neutral
SellBuy
Strong sellStrong buy
Strong sellSellNeutralBuyStrong buy
Neutral
SellBuy
Strong sellStrong buy
Strong sellSellNeutralBuyStrong buy
Neutral
SellBuy
Strong sellStrong buy
Strong sellSellNeutralBuyStrong buy
A representation of what an asset is worth today and what the market thinks it will be worth in the future.
Displays a symbol's price movements over previous years to identify recurring trends.
Frequently Asked Questions
The current price of Micro S&P 500 Futures is 6,470.25 USD — it has risen 1.02% in the past 24 hours. Watch Micro S&P 500 Futures price in more detail on the chart.
The volume of Micro S&P 500 Futures is 4.39 K. Track more important stats on the Micro S&P 500 Futures chart.
Open interest is the number of contracts held by traders in active positions — they're not closed or expired. For Micro S&P 500 Futures this number is 24.86 K. You can use it to track a prevailing market trend and adjust your own strategy: declining open interest for Micro S&P 500 Futures shows that traders are closing their positions, which means a weakening trend.
Buying or selling futures contracts depends on many factors: season, underlying commodity, your own trading strategy. So mostly it's up to you, but if you look for some certain calculations to take into account, you can study technical analysis for Micro S&P 500 Futures. Today its technical rating is buy, but remember that market conditions change all the time, so it's always crucial to do your own research. See more of Micro S&P 500 Futures technicals for a more comprehensive analysis.