ES UpdateNot many of my followers trade futures, but in case I don't have time to post an update before work tomorrow:
1) Another open gap down. I don't think it fills until RSI hits oversold and we get a bounce.
2) Dollar index broke support, but wouldn't surprise me if it did a backtest (maybe)
3) Gold trying to "break out" yet again, but a dollar backtest will look like another failed breakout (maybe)
4) Lots of earnings this week including TSLA Tues.
I established a long position in gold, but I intend to hold it for a while. Not my usual short term trade. No desire to go long on stocks during earnings season when every company is going to be talking about tariff impacts.
WSP1! trade ideas

Weekly Market Forecast: Stocks Markets Are Stalled! Patience!In this video, we will analyze the S&P 500, NASDAQ, and DOW JONES futures for the week of April 21 - 25th
The Markets are stalled! No bullish follow through from the previous week. Last week failed to break the previous weekly high. This stall out looks consolidative and unclear. Wait for clarity! Let the markets break the high or low of the range convincingly... and trade accordingly.
Enjoy!
May profits be upon you.
Leave any questions or comments in the comment section.
I appreciate any feedback from my viewers!
Like and/or subscribe if you want more accurate analysis.
Thank you so much!
Disclaimer:
I do not provide personal investment advice and I am not a qualified licensed investment advisor.
All information found here, including any ideas, opinions, views, predictions, forecasts, commentaries, suggestions, expressed or implied herein, are for informational, entertainment or educational purposes only and should not be construed as personal investment advice. While the information provided is believed to be accurate, it may include errors or inaccuracies.
I will not and cannot be held liable for any actions you take as a result of anything you read here.
Conduct your own due diligence, or consult a licensed financial advisor or broker before making any and all investment decisions. Any investments, trades, speculations, or decisions made on the basis of any information found on this channel, expressed or implied herein, are committed at your own risk, financial or otherwise.

E-mini S&P 500 Outlook for next week. Thought process is the same just like NQ1!. Want massive buyside expansion. But weekly profiles need to be there. Tuesday/Wednesday Low of the Week is what I' personally looking for.
So expecting an SMT Divergence on the Previous Weekly Sellside . And then a massive push up.
2nd Stage Distribution on Market Maker Buy Model. Offset it is. Crosshairs on 5529

S&P 500 (ESM) - Volatility Only Professionals Can TradeThe amount of volatility that has presented itself in ES has been astronomical! Usually when we see dollar selling off (presenting risk on conditions), ES, NQ and YM would usually pick up momentum and rally higher, attacking premium arrays and buyside liquidity pools but now we are seeing a change.
When will we see normal conditions in the market?

SPX Lulling Market to Sleep Before a Big Move to 4211It looks like a triangle.. but it's not. ES showing impulsive moves lower after an ABC move to the upside petered out.
Those looking for triangle-like continuation of a rally may be holding on for dear life this week. Nonetheless, look for the upside to 5450+ and complete the right side of a diamond structure when futures open.

Friday Closeout | TA & Macro Recap + ES1! Game Plan📈 Chart Overview
Current Price: 5,312.75
Daily Candle: Slight green candle, suggesting an attempt at recovery or a pause in the recent downtrend.
📈 Price Action & Technical Analysis
SMA 9 (thin white): ~5,309.92 – Hugging current price, curling upward.
SMA 50 (light blue) : ~5,759.54 – Above current price; Below SMA 200; indicating bearish pressure. (Death Cross)
SMA 200 (thick cyan): ~5,890.90 – Above current price; Curling downward; longer-term downtrend signal.
Structure: After a heavy decline in early April, price bounced on changing tariff paradigm, but is stalled short of the Prior Swing Support.
This could be: A bear flag forming. Or. A basing pattern for a short-term reversal.
📈 RSI (14 Close)
Current: 41.48 (37.49 MA)
Interpretation: Below neutral (50), momentum is weak. A move back above 50 would be bullish. A turndown could indicate further weakness.
Recent Bounce: RSI bounced from ~21, indicating the recent lows were oversold. Currently appears to be consolidating.
📈 MACD (12, 26, 9)
MACD Line: -132.13
Signal Line: -125.86
Histogram: +6.27 and rising
Interpretation:
MACD is negative (bearish territory), but the histogram flipped positive, showing momentum may be improving.
Bullish crossover is in progress, but at the moment, weak. A potential signal for a short-term upside move.
🎯 Key Levels
Resistance: 5,300 (Prior Week Base Levels) to 5,384 (Prior Swing Support) is current price zone of interest
Support: Recent low just above 5,000 is critical — a break below should continue the downtrend.
🧨 Volatility Outlook
TVC:VIX falls well within the 'Risk off Zone'.
TVC:VIX spiked to 52.33 before receding to its current 29.65
📈 Macro/Fundamental Analysis
Interpretation:
In high TVC:VIX environment, with Tariff, Fiscal, and Political Uncertainty, price action will likely remain mercurial. This is likely to persist into the foreseeable future.
TVC:DXY Dollar weakness has continued. Likely causes include: Fed Cut Expectations increasing & Decreasing Demand for US treasuries TVC:US10Y . I expect the weakening dollar to persist. All else qual, a weakening dollar is bullish for asset pricing, though, in the face of expect growth challenges, the effect is negated.
I expect US10Y sales to continue to struggle, in the face of inflation risk and rising trade tensions.
Bearish Possibilities:
Expect continued talk about 'firing' the current fed chair. The market should react poorly to these threats if they intensify or become increasingly probable.
Failures on trade talks with major trading partners.
Bullish Possibilities:
Improved earnings or earnings guidance, though, I expect this is unlikely.
Successes on trade talks and deals with major trading partners.
Fed Rate cuts - though - i expect this is highly unlikely.
Fed QE - thought - i expect this is highly unlikely in the short term, barring an explosion in TVC:US10Y yields.
📆 Economic Calendar / Earnings Schedule
Econ Calendar: Relatively Light Next Week
Thursday - 830AM - Initial Jobless Claims
Thursday - 830AM - Durable Goods
Friday - 10AM - Michigan Consumer and Inflation Expectations
Notable Earnings Calendar:
Verizon NYSE:VZ - Tuesday
Lockhead NYSE:LMT - Tuesday
Ratheon NYSE:RTX - Tuesday
Tesla NASDAQ:TSLA - Tuesday
Boeing NYSE:BA - Wednesday
Google NASDAQ:GOOG - Thursday
Intel NASDAQ:INTC - Thursday
Pepsi NASDAQ:PEP - Thursday
Proctor and Gamble NYSE:PG - Thursday
T-Mobile NASDAQ:TMUS - Thursday
🔍 Summary
🔻 Trend: Bearish below 50- and 200-day SMAs and recent 'Death Cross'.
🧩 Momentum: Turned bullish, with flat to fading strength.
🧠 Tactics:
Short Term: Expect Ranging with slight bullish upside. Likely good day trading environment.
Medium Term: Dead-cat bounce or Early Reversal ...? Watch for:
Daily Close above the local swing high's or Low's
If we breakout higher, look for further Daily Rejection at the moving averages (especially SMA 50).
If we breakdown lower, look for a retest of the 5000 psychological support, down to, 4832.50.

Sideways structureThe structure in the S&P 500 daily chart implies a sideways market environment. The market is waiting for an excuse to rally or break.

April 17th Trade Journal & Stock Market AnalysisApril 17th Trade Journal & Stock Market Analysis
EOD accountability report: +816.25
Sleep: 6 hour, Overall health: Testing out new supplement, Sleep has been low, but energy level has been good. (testing out Ocimum tenuiflorum for sleep and adding Ginkgo Biloba W/LM)
**Daily Trade Recap based on VX Algo System**
9:29 AM Market Structure flipped bearish on VX Algo X3!
11:05 AM VXAlgo YM X1 Buy Signal
11:47 AM Market Structure flipped bullish on VX Algo X3!
3:30 PM Market Structure flipped bearish on VX Algo X3!
3:40 PM VXAlgo ES X1 Buy signal (double signal)
**Monday plan--> **watch for rejection of 48M Resistance for breakdown to 1D MOB

Daily Price Action: S&P500 Emini Futures ES1!In this video, we will be looking into the potential price action of ES1!.


S&P 500 E-mini Futures – Bearish Setup Ahead?Price recently tapped into a key resistance zone where an imbalance was filled by a wick, showing signs of potential exhaustion. We could see a liquidity grab above before a significant move down toward the 5,150 level. Watch for a reaction in the highlighted resistance area – this could be the beginning of a bearish reversal. Major support sits lower, where a larger move might find footing.
🔹 Resistance tested
🔹 Imbalance filled
🔹 Bearish reaction anticipated
🔹 Targeting the 5,150 zone
Let me know your thoughts – do you see the same setup?


Still Need Some Correction For S&P500 / ES Before Going UpAttention: Prices are read on the futures chart, so they might be different if you are reading on cash charts. But directions and realtionships, should be very similar.
I believe S&P is in a very volatile correction and it is a bit hard to read.
To me it looks like price completed a green (a) of the grey ((y)) wave with a failed 5th and started the green (b) wave with a very aggressive purple a wave.
I believe we are now finishing the blue a-b-c correction in a c-wave diagonal and I would like to see it go down to 5110 area in the green box, for the c wave to have room to develop into the yellow box in the 5530 area.
If price is heading above the 5630 area, I would start to look for another count, since this would mean the green (a)-(b)-(c) correction should have been a flat, and since the green (a) wave is not counted in three waves, this can't be correct.
Right now I would like price to go down to the 5110 area, then back up to the 5530, and then we start the last green (c) wave of the grey ((y)) correction.
And this green (c) wave has plenty of room. All the way down to 4176 before it invalidates the count.
After all this correction, happy days are starting again, where the 5th wave could be heading for the 6500 to 7000 area.

Quick recapMy opinion about s&p. Modest gain eyeing these 2 weeks, I am really expecting some gain from crazy gold prices and super undervalued dollar. Most likely we will see some progression with regard to negotiation between us and Japan, and boosting confidence on us equity & currency.

Absorption dayAfter the S&P break to the downside on the daily chart, the expectation is that on Thursday the market will trade inside the range of Wednesday's action as the market absorbs what happened with fundamental comments on Wednesday. New bearish news could push the market lower but that is not expected for Thursday.

ES UpdateSame as NQ, indicators did not go oversold yet, but looks like the EUros set up for an ECB rate cut bump tomorrow morning. MFI might hit oversold premarket tomorrow.
Note that ES filled the NVDA gap but still has the original tariff gap above.

ID: 2025 - 0084.16.2025
Trade #8 of 2025 executed. So simple, yet far from easy...
Trade entry at 93 DTE (days to expiration).
The last few weeks have been quite challenging, mostly due to increase volatility (3rd highest expansion in history), as well as widening bid/ask spreads. This trade idea will dovetail with trade id: 006 to balance delta without incurring more slippage due to spreads. This trade will hold to expiration without any adjustments until the final 30 days of trade life.
Happy Trading!
-kevin

How To Connect Your NinjaTrader Account To TradingViewHow to connect your NinjaTrader brokerage account to be able to trade on TradingView.

SPY Futures April 2025Trump imposes new tariffs on imports from China, investors panic, and the market chops. A good level to look at on SPY Futures for the next couple weeks is 5528.00. I believe a break upwards can give bullish investors some confidence , while a rejection could bring even more downside. If we break upwards, possibly revisiting 5840.00, we're going to have to see if we can break that level and get back to the all time high. If we reject and price falls, the level to look at is 4833.00. A break of that support could mean a lot more downside in the coming months. But we're going to have to be patient allow Trump vs China to unfold.

April 15th Trade Journal & Stock Market AnalysisEOD accountability report: +940
Sleep: 8 hour, Overall health: Good
**Daily Trade Recap based on VX Algo System **
9:30 AM Market Structure flipped bullish on VX Algo X3! - easy money
10:10 AM VXAlgo ES X1 Sell Signal - easy money
1:02 PM Market Structure flipped bearish on VX Algo X3! - easy money
1:40 PM VXAlgo ES X1 Buy signal (triple signal) -a bit tuff but still work out
3:30 PM VXAlgo ES X1 Sell Signal (double signal) - a bit tuff but still work out
**Wed plan: ** Watch for 48M support or 195M support to tag around 5200-5300s.

Neutral zone marketThe structure in the S&P for the last couple days implies a neutral zone market. This means that both buyers and sellers are present with no one group being dominant. The expectation is for a sideways move until we get fundamental information primarily tariff information that will give the market an excuse to rally or break.

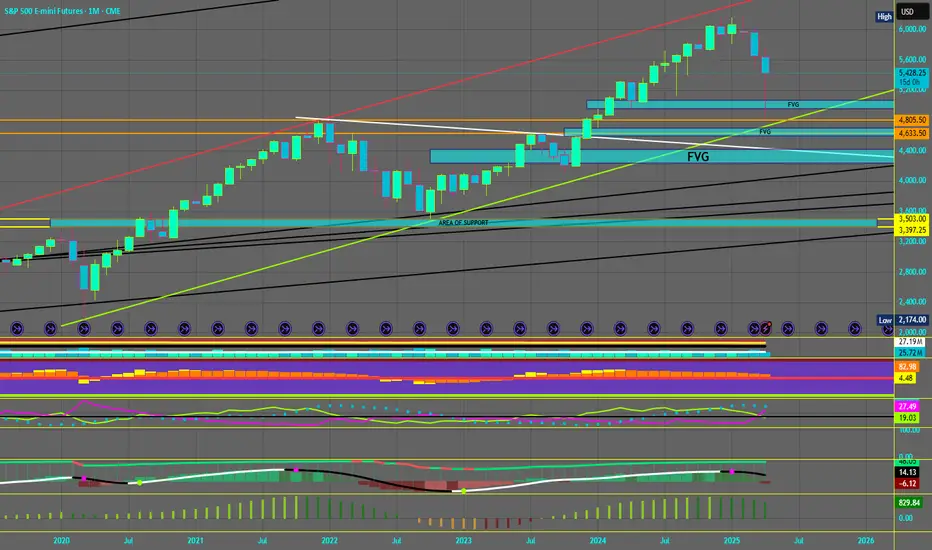
The stage is set for the markets next move! #SPX SP:SPX levels to watch!
4600-4800 must hold or we could see 3400-3500 as our next major area of support!
S&P 500 and Bitcoin are bearish. Big dump incoming.We bounced back thanks to Trump's bullish announcements but we're right back up at major resistance and we're moving sideways. With major resistance, you want to see price cut straight through like a laser. You don't want to see price hesitating. A bearish geometric pattern leading up to resistance almost always rejects and retests the lows.
