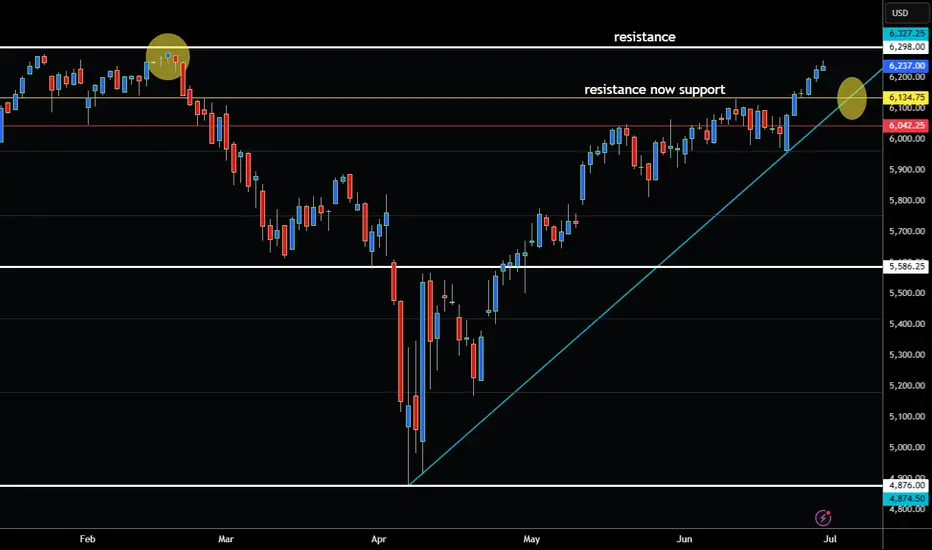
S&P 500 ABOUT TO TEST CRITCAL RESISTANCE LEVEL!Hey Traders so today watching S&P500 and looks like strong resistance at 6300.
Market can do 1 of 3 things like before.
Pause, Reverse, or Breakthrough so if your long watch for reversals. If not watch for pullback to new support level around 6135. Can be a nice area to enter new long positions in the buy zone.
Place stops under trendline around 6040.
Remember trend is your friend so if bullish wait for pullback. However if bearish wait for break below trendline to confirm market wants to break lower.
Also watch Nasdaq 100 because it normally leads the market higher. If S&P rises but Nasdaq is holding back it's not a good sign for breakout.
Always use Risk Management!
(Just in we are wrong in our analysis most experts recommend never to risk more than 2% of your account equity on any given trade.)
Good Luck & Hope This Helps Your Trading 😃
Clifford
WSP1! trade ideas
SP500 - Cycle Analysis; New V-Bottom24 Dec 2018 - V-Bottom Trough:
This marks a clean V-bottom. Both the 227-ROC and 114-ROC showed simultaneous positive acceleration after price reacing its low. Shortly after, both crossed their 57-SMA almost in sync — increasing the probability of a sustained bullish move. Price confirmed this by breaking resistance and forming a V pattern. This was further validated by the centered moving average crossover (114-CMA crossing above 227-CMA).
25 Mar 2020 - Deep COVID Crash Trough:
During this phase the priced broke below the support, creating a deep trough. Altough both ROC lines initially showed strong negative acceleration due to the COVID-19 crash, they soon reversed above their 57-SMAs, signaling a major shift in momentum. This coincided with the price breaking above the key resistance which was also crossed in 2019 when confirming the old V-pattern. After this breakout, a brief pullback followed before the uptrend resumed with increasing strength.
22 Jun 2021 to 19 Dec 2023 - Pattern
During the initial period a bearish divergence was visible in the ROC, nevertheless price and rate of change both declined making a low in early October 2022. A technical pattern began to form, which appears to align more closely with a symmetrical triangle; So when measuring its height and projecting it from the breakout point aligns with the new all-time highs that were reached on 27 June 2025.
21 Mar 2025 - New Cycle Trough
A new V-bottom formed shortly after the current cycle began. Both ROC indicators had already crossed their SMAs to the upside, showing early signs of positive acceleration, days before of price broke through the resistance and reached the new record high.
The 227-SMA is likely to cross from below the fast SMA while a possibility of a pullback increase.
Following that, the 114-CMA will probably has the chance to cross back the 227-CMA, with the price potentially confirming a new support level and resuming its uptrend - in line with the broader cycle timeline.

Risk On! Buy Stock Indices, Sell Gold, Silver.In this Weekly Market Forecast, we will analyze the S&P 500, NASDAQ, DOW JONES, Gold and Silver futures, for the week of June 29 - July 4th..
Stock Indices are pointed to the all time highs. Take advantage of the "risk on" environment while it lasts!
Gold and Silver have seen the outflows and profit taking... so look for lower prices this week.
Oil ... be patient. After a huge dump in prices when the tensions eased up between Israel/US and Iran, price is moving sideways in consolidation. I suspect lower prices to come, but I urge patience! Wait for the signature of price to show it intends to move lower. A sweep of the range highs and a run of the range lows right after... is the signal to sell.
Enjoy!
May profits be upon you.
Leave any questions or comments in the comment section.
I appreciate any feedback from my viewers!
Like and/or subscribe if you want more accurate analysis.
Thank you so much!
Disclaimer:
I do not provide personal investment advice and I am not a qualified licensed investment advisor.
All information found here, including any ideas, opinions, views, predictions, forecasts, commentaries, suggestions, expressed or implied herein, are for informational, entertainment or educational purposes only and should not be construed as personal investment advice. While the information provided is believed to be accurate, it may include errors or inaccuracies.
I will not and cannot be held liable for any actions you take as a result of anything you read here.
Conduct your own due diligence, or consult a licensed financial advisor or broker before making any and all investment decisions. Any investments, trades, speculations, or decisions made on the basis of any information found on this channel, expressed or implied herein, are committed at your own risk, financial or otherwise.

here is the #chart for $SPY $SPX #ES_F Bullish with caution. AMEX:SPY is near all-time highs at $614.91, up 0.52% daily and 4.83% monthly, driven by trade deal optimism and expected Fed rate cuts. Technicals show a strong buy signal, but failure to break 6178.75 could signal a pullback. Tariff risks and inflation (core PCE at 2.7%) add caution
"Pricing Perfection: The Thin Ice Beneath Record Highs"As markets push to all-time highs, the rally feels less like euphoria and more like walking a tightrope. What happens when the market prices in perfection
The S&P 500 is sitting at all-time highs, not because the world is perfect — but because the market is betting that it will be. This rally is no longer driven by surprises or revisions — it’s driven by expectations that everything will go right: inflation will cool, rates will drop, earnings will beat, AI will deliver, and geopolitical tensions will stay neatly compartmentalized.
In reality, we are walking on thin ice. Beneath the surface lies fragile market breadth, decelerating economic data, and a Fed that continues to speak hawkishly even as liquidity props things up. Any minor deviation from this “Goldilocks” scenario — a hot CPI, a guidance miss from a mega-cap, or a geopolitical headline — has the power to trigger sharp repricing.
When the market prices in perfection, it doesn’t need a bear to show up. It just needs something less than ideal. At these levels, risk becomes asymmetric — all reward is front-loaded, but the pain, if it comes, is unpriced and sudden.
The current equity landscape isn’t just optimistic — it’s priced for flawless execution across earnings, rates, geopolitics, and liquidity.
That leaves asymmetric downside risk if even a minor narrative breaks. Trump has become know for creating larger than minor narratives... ;)

06/27/25 Trade Journal, and ES_F Stock Market analysis 06/27/25 Trade Journal, and ES_F Stock Market analysis
EOD accountability report: +915
Sleep: 6 hours
Overall health: edgy from sleep
** VX Algo System Signals from (9:30am to 2pm) 3/4 success**
9:37 AM VXAlgo ES X1 Buy signal :check:
9:55 AM Market Structure flipped bullish on VX Algo X3! :check:
10:31 AM VXAlgo ES X1 Sell Signal (double sell) iffy
1:43 PM Market Structure flipped bearish on VX Algo X3! :check:
**What’s are some news or takeaway from today?
and What major news or event impacted the market today?
**
Early on in the market, I noticed that there was heavy manipulate by the MM with violent buy and sell. This somewhat warns that today's market could be tough to trade and you have to be very patient.
News
PRES TRUMP: ENDING ALL TRADE TALKS WITH CANADA; WILL TELL CANADA ITS TARIFF LEVEL IN COMING DAYS - around 1 :40pm est
What are the critical support levels to watch?
--> Above 6200= Bullish, Under 6185= Bearish
Video Recaps -->https://www.tradingview.com/u/WallSt007/#published-charts

Confidence going into the weekendA stronger close in the S&P 500 daily chart above 6235 would imply the higher confidence going into the weekend. This would indicate that buyers are willing to hold onto positions going into the weekend.

06/26/25 Trade Journal, and ES_F Stock Market analysis 06/26/25 Trade Journal, and ES_F Stock Market analysis
EOD accountability report: +731.25
Sleep: 5 hours
Overall health: meh
** VX Algo System Signals from (9:30am to 2pm) 3/3 success**
— 9:38 AM Market Structure flipped bullish on VX Algo X3
— 10:30 AM Market Structure flipped bullish on VX Algo X3!
— 11:27 AM VXAlgo ES X1 Sell Signal
What’s are some news or takeaway from today?
and What major news or event impacted the market today?
today was another interesting day, i am noticing that when market structure changes 2x in the same direction, it is usally pretty effective and scammy at the same time
News
*NVIDIA NASDAQ:NVDA SHARES HIT A NEW HIGH TO RECLAIM WORLD'S LARGEST STOCK TITLE - market is being carried by the momentum of mag 7
What are the critical support levels to watch?
--> Above 6175 = Bullish, Under 6155= Bearish
Video Recaps -->https://www.tradingview.com/u/WallSt007/#published-charts

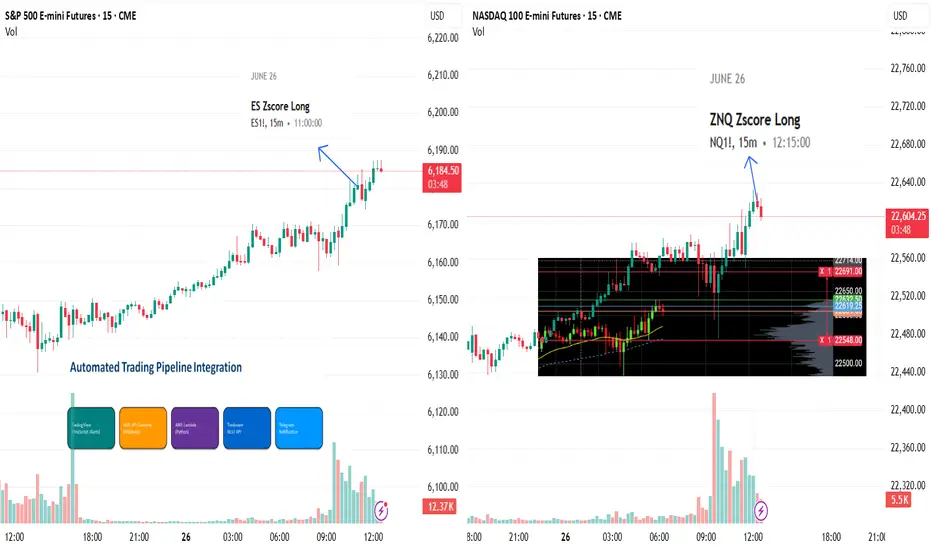
June 26: Long ES and NQ
My two algorithmic strategies each generated a signal. The signals were triggered live in TradingView and sent via web-hook to AWS. From there, an AWS Lambda function processed the alerts and placed the orders through the Tradovate API directly into the Tradovate platform.
ES/SPX All Time High 06/26/2025This is simply a markup of what I think will take place as historically every time ES/SPX hits an all time high it makes a 80-120 point trend downward to fill gaps and I feel like this time is no different.

Wait and see market environmentThe structure on Wednesday in the S&P 500 daily chart implies some market that is in a balanced condition and provides a wait and see market environment. It is waiting for additional information to respond to. The biases still for move to the upside. The next objective higher is 6175.

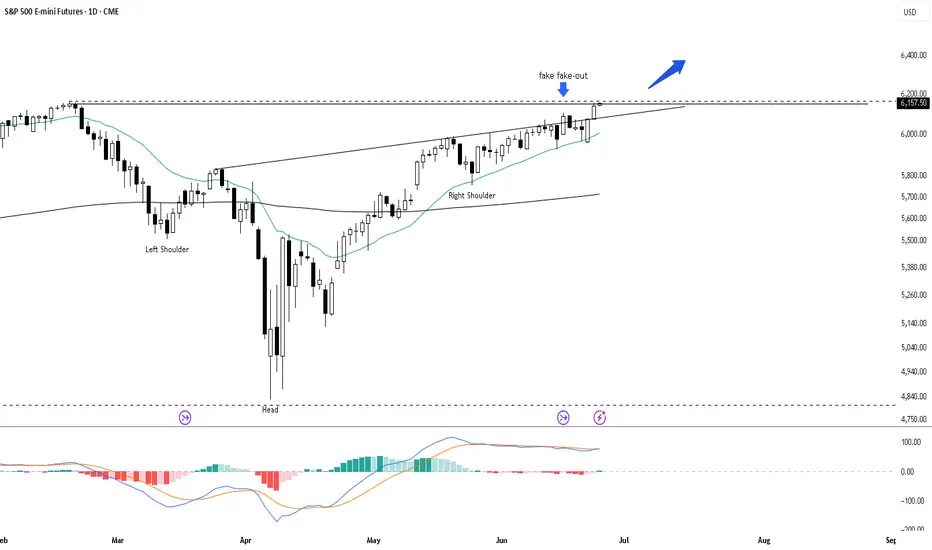
SPX Bullish Breakout: 18% Upside to $7,300The S&P 500 has broken out of an inverse head and shoulders formation, targeting approximately $7,300 within three months. The MACD shows strong bullish momentum with a recent crossover above the signal line. The price is holding above the 21-day EMA, further confirming bullish momentum.
06/24/25 Trade Journal, and ES_F Stock Market analysis EOD accountability report: -717.50
Sleep: 4.5 hours - heat waves in nyc
Overall health: meh
** VX Algo System Signals from (9:30am to 2pm)** 4/4
9:40 AM Market Structure flipped bullish on VX Algo X3! 5 pts
9:42 AM VXAlgo NQ X3 Buy Signal (failed)
11:00 AM Market Structure flipped bullish on VX Algo X3! 20pt
11:58 AM VXAlgo NQ X1 Sell Signal (failed)
What’s one key lesson or takeaway from today?
and What major news or event impacted the market today?
There are days that the algo will lose but you just gotta trust the process and execute accordingly with a stoploss.
What are the critical support levels to watch?
--> Above 6130 = Bullish, Under 6125= Bearish
Video Recaps -->https://www.tradingview.com/u/WallSt007/#published-charts

Fundamental supportFundamentals are supporting buyers in the S&P 500 daily chart. The expectation is for this support to continue on Wednesday with a positive close.


PREVIEW LONDON SESSION - Tue 24th June 2025 --- LONGWe had one demand filled day.
And I don't see it stopping. We have blown through 100 and 125 projections and I predict 150 will be reached soon. SO, after london open I will be looking for LONG discounts on the 5m/15m charts and targeting 6162.50 (poc strike) that coincides with 150 (PINS OFF) projection.

Potential strong up dayIf the cease-fire holds between Iran and Israel, expect a strong up day in the S&P 500 daily chart. 6125 is the next objective to the upside.

LONG TRADE @ EUROPE OPEN - Monday 23rd JuneLong a after demand from 6000
weak liquidity above FB below.
Wanting a squeeze higher into yellow lined weak liquidity there.

SHORT @ London Open - Monday June 23rd 2025I believe Sellers are in control of the auctions. I see a nice distribution wall above to launch shorts from. Target the 150 where there seems to be liquidity target making sense of a short trade. ALWAYS wait for Lopen. Demand may come in and take over 6025/Dist Wall. If so there is plenty to like about the LONGS then with liquidity above. How price comes into 6025 at Lopen is what we need to be looking for.

06/20/25 Trade Journal, and ES_F Stock Market analysis06/20/25 Trade Journal, and ES_F Stock Market analysis
EOD accountability report: +1437.50
Sleep: 6 hours
Overall health: hanging in there
** VX Algo System Signals from (9:30am to 2pm)**
— 6/20/2025 9:30 AM VXAlgo ES X1 Sell Signal (double sell) :check:
— 6/20/2025 10:30 AM Market Structure flipped bearish on VX Algo X3! :check:
— 6/20/2025 11:14 AM VXAlgo ES X1 Buy signal (triple buy) :check:
What’s one key lesson or takeaway from today?
and What major news or event impacted the market today?
Fed's Barkin: There is nothing urgent in the data warranting a rate cut at this point.
What are the critical support levels to watch?
--> Above 6015 = Bullish, Under 6005= Bearish
Video Recaps -->https://www.tradingview.com/u/WallSt007/#published-charts

Quo Vadis - "Where we have come to"Here is is a daily bar chart of the MES1! showing where we have come made up from TV Community scripts. (No coding required.) But the question of course is where do we go from here in light of all the current circumstances: Middle East War, Tariff, Interest Rates, etc Will we see a new All Time High in the S & P 500? This chart does not show a reversal yet. I am staying LONG until the market and the chart says something different.


06/18/25 Trade Journal, and ES_F Stock Market analysis
EOD accountability report: +521.25
Sleep: 5 hours (bad sleep)
Overall health: My Ultrahuman Ring is saying I might be getting sick. 9 need to recover sleep and take care of body today and tmr. I think my lack of exercise this week is catching up to me.
**What was my initial plan? **
Looking at things premarket, things looked a bit weak as it was about sell off in the morning with bearish structure and DHC. Went in for a short at 1 min MOB but it didn't react and just broke thru, so flipped to bullish side and took it to the next resistance.
overall plan for the day was to look for chop zones to scalp b4 fomc, but that actually didnt happen until after fomc.
** VX Algo System Signals from (9:30am to 2pm)** 4/5
— 9:50 AM Market Structure flipped bullish on VX Algo X3! :check:
— 10:52 AM VXAlgo ES X1 Sell Signal :check:
— 12:10 PM VXAlgo ES X1 Buy signal (Double signal) :x:
— 12:11 PM Market Structure flipped bearish on VX Algo X3! :check:
— 1:40 PM VXAlgo ES X1 Buy signal (Double signal) :check:
Next day plan--> Above 6015 = Bullish, Under 6005= Bearish
