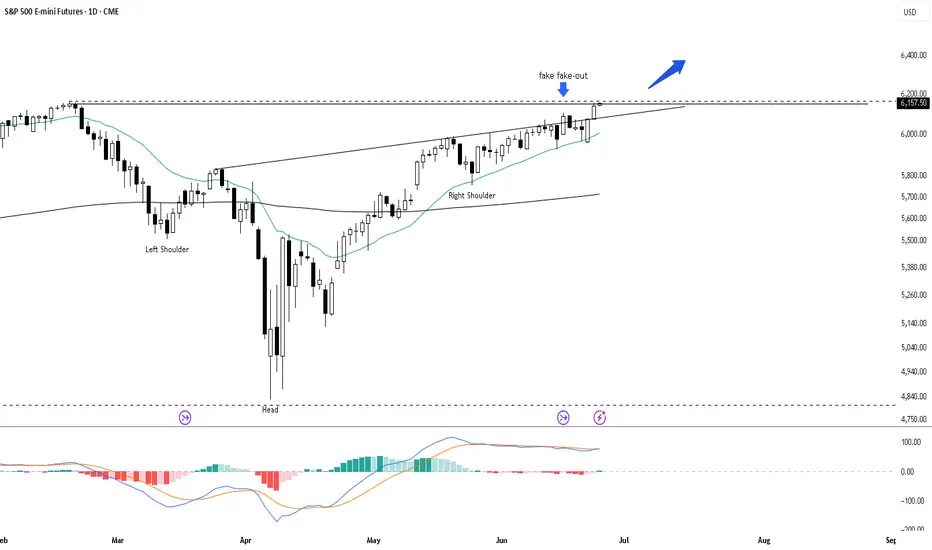
SPX Bullish Breakout: 18% Upside to $7,300The S&P 500 has broken out of an inverse head and shoulders formation, targeting approximately $7,300 within three months. The MACD shows strong bullish momentum with a recent crossover above the signal line. The price is holding above the 21-day EMA, further confirming bullish momentum.
WSP1! trade ideas
06/24/25 Trade Journal, and ES_F Stock Market analysis EOD accountability report: -717.50
Sleep: 4.5 hours - heat waves in nyc
Overall health: meh
** VX Algo System Signals from (9:30am to 2pm)** 4/4
9:40 AM Market Structure flipped bullish on VX Algo X3! 5 pts
9:42 AM VXAlgo NQ X3 Buy Signal (failed)
11:00 AM Market Structure flipped bullish on VX Algo X3! 20pt
11:58 AM VXAlgo NQ X1 Sell Signal (failed)
What’s one key lesson or takeaway from today?
and What major news or event impacted the market today?
There are days that the algo will lose but you just gotta trust the process and execute accordingly with a stoploss.
What are the critical support levels to watch?
--> Above 6130 = Bullish, Under 6125= Bearish
Video Recaps -->https://www.tradingview.com/u/WallSt007/#published-charts

Fundamental supportFundamentals are supporting buyers in the S&P 500 daily chart. The expectation is for this support to continue on Wednesday with a positive close.


Look at the high/lowsThe /ES may be going down but it tapped both top and bottom levels than rebounded. looking to begin a resurgence with a hammer formation.

PREVIEW LONDON SESSION - Tue 24th June 2025 --- LONGWe had one demand filled day.
And I don't see it stopping. We have blown through 100 and 125 projections and I predict 150 will be reached soon. SO, after london open I will be looking for LONG discounts on the 5m/15m charts and targeting 6162.50 (poc strike) that coincides with 150 (PINS OFF) projection.

Potential strong up dayIf the cease-fire holds between Iran and Israel, expect a strong up day in the S&P 500 daily chart. 6125 is the next objective to the upside.

A Trend on Borrowed Time, A Micro ED within a Larger ED?Since mid-last month, the broader equity market has been grinding higher — but not with confidence.
The advance has been marked by choppy, overlapping price action that feels more hesitant than bullish. Yes, prices continue carving out higher highs and higher lows, but MACD momentum tells a different story. With every push upward, the MACD weakens, flashing warning signs beneath the surface. Taken through the lens of Elliott Wave theory, this unfolding pattern carries all the classic fingerprints of an Ending Diagonal — a structure that often signals a trend on borrowed time.
Key Characteristics of an Ending Diagonal:
1. Position in the Wave Structure:
A. Occurs in Wave 5 of an impulse wave or Wave C of a corrective pattern (such as a zigzag or flat).
B. Rarely, but sometimes, seen in Wave 3 of an impulse, but this is generally associated with a leading diagonal, not an ending one.
2. Structure:
A. Composed of five sub-waves, labeled (i), (ii), (iii), (iv), (v).
B. Each of these sub-waves subdivides into 3 waves (i.e., they are all corrective or "3-wave" structures, often labeled as a-b-c).
C. This gives the whole pattern a distinct 3-3-3-3-3 internal structure.
3. Price Behavior:
A. Overlapping waves: Wave 4 often overlaps with the price territory of Wave 1, which is normally a rule violation for standard impulsive structures — but it's allowed in an ending diagonal.
B. Converging trendlines: The upper and lower boundaries of the diagonal typically form converging lines (like a wedge), though they can also be parallel in some cases.
C. Diminishing momentum: Often accompanied by momentum divergence, meaning price makes a new high or low, but momentum indicators (MACD, RSI) do not confirm.
4. Implication:
A. An ending diagonal suggests the current trend is running out of steam.
B. Once complete, a sharp reversal or significant correction is expected.
In my analytical view, the byproduct of an Ending Diagonal often lures market participants into a conflicted state — cautious, yet unable to ignore the persistent upward grind. You’ve probably heard the old market adage: “Don’t fight the tape.” In this case, that mentality sets in as traders, wary but worn down, finally throw in the towel and join the advance — only for the market to seemingly punish that decision with a sharp reversal.
Many experienced traders describe their Ending Diagonal experience the same way: “The moment I finally stopped fighting the trend and got long, it was as if the market was waiting for me — and reversed hard.”
That is how I would describe this micro ED we appear to be in the final stages of what I’m counting as the micro wave v of (v) of Minor A.
For now, no key structural support levels within the Micro Ending Diagonal have been breached, so the advance can certainly stretch a little higher. But make no mistake — in my opinion, this remains one of the most dangerous, deceptive patterns to engage with.
Last week, I closed my short out-of-the-money ES call positions during the micro wave iv pullback (not shown on the above chart). Ideally, I’m looking for an opportunity to reestablish a similar position this week. From there I will reassess the larger Ending Diagonal pattern you see outlined on the chart above.

LONG TRADE @ EUROPE OPEN - Monday 23rd JuneLong a after demand from 6000
weak liquidity above FB below.
Wanting a squeeze higher into yellow lined weak liquidity there.

SHORT @ London Open - Monday June 23rd 2025I believe Sellers are in control of the auctions. I see a nice distribution wall above to launch shorts from. Target the 150 where there seems to be liquidity target making sense of a short trade. ALWAYS wait for Lopen. Demand may come in and take over 6025/Dist Wall. If so there is plenty to like about the LONGS then with liquidity above. How price comes into 6025 at Lopen is what we need to be looking for.

06/20/25 Trade Journal, and ES_F Stock Market analysis06/20/25 Trade Journal, and ES_F Stock Market analysis
EOD accountability report: +1437.50
Sleep: 6 hours
Overall health: hanging in there
** VX Algo System Signals from (9:30am to 2pm)**
— 6/20/2025 9:30 AM VXAlgo ES X1 Sell Signal (double sell) :check:
— 6/20/2025 10:30 AM Market Structure flipped bearish on VX Algo X3! :check:
— 6/20/2025 11:14 AM VXAlgo ES X1 Buy signal (triple buy) :check:
What’s one key lesson or takeaway from today?
and What major news or event impacted the market today?
Fed's Barkin: There is nothing urgent in the data warranting a rate cut at this point.
What are the critical support levels to watch?
--> Above 6015 = Bullish, Under 6005= Bearish
Video Recaps -->https://www.tradingview.com/u/WallSt007/#published-charts

We may see lower prices for S&P FuturesHi Trading Community,
Over the past few weeks, I've been emphasizing the bullish nature of the market. However, in today’s video, I’m urging caution on long positions. Given current geopolitical trends and the recent candlestick formations, there’s a possibility we could see lower prices on the ES.
Join me as I walk through a revised top-down analysis of the ES for this new September contract period.

S&P 500 E-mini Futures In the S&P 500 futures (/ES), a decisive break and close below 5965 would confirm bearish structure on the higher time frames, signaling a shift in market sentiment. Following the break, we anticipate a corrective pullback toward the 6000–6010 supply zone. This retracement can offer an optimal short entry, with the initial downside target set at 5900, aligned with the next liquidity pool and previous demand zone

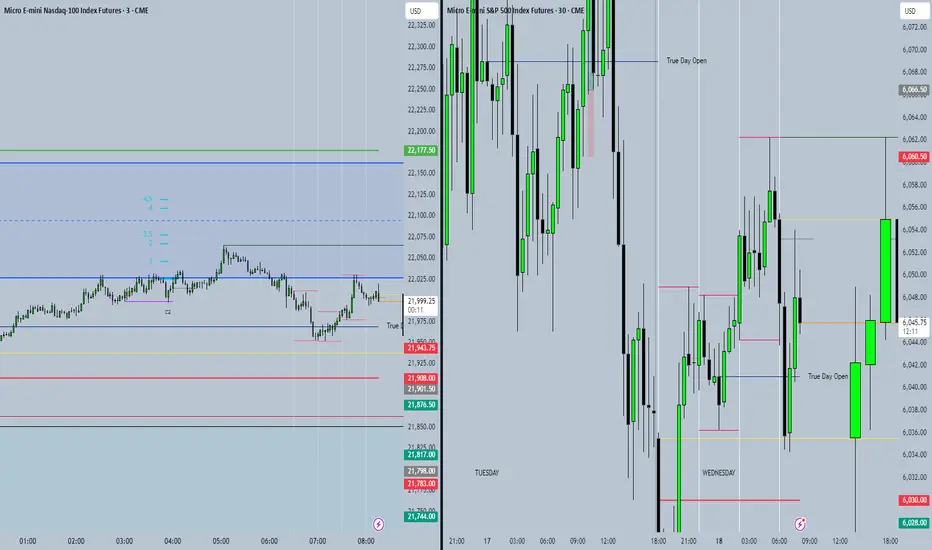
Watch These Reversals – MES & MNQ at Major 4H Turning Points!Chart Breakdown: MES1! & MNQ1! – 4H Timeframe Analysis by GOAT
This dual-pane chart presents a detailed technical analysis of the E-mini S&P 500 Futures (MES1!) and Micro Nasdaq Futures (MNQ1!) on the 4-hour timeframe, designed with a custom visual aesthetic and proprietary tools by GOAT.
🔺 Left Panel – MES1! (4H):
Price Action: MES is trading within a broad rising channel, currently testing key support near 6,020 after a textbook Head and Shoulders formation.
Overlays: A dynamic channel structure and multiple Fibonacci-like zone levels guide potential bounce or breakdown scenarios.
Bearish Divergence: RSI shows clear bearish divergence leading into the recent highs—highlighted with trendline markers.
Support Zones: Immediate support around 5,973, with deeper support levels around 5,905 and 5,808 if breakdown confirms.
🔵 Right Panel – MNQ1! (4H):
Structure: MNQ is also respecting a broader bullish channel with intermediate pullbacks. Current structure shows an active Inverse Head and Shoulders setup with a neckline breakout possible above 21,930.
Trade Markups: An active long trade is visible with entry, stop-loss, and take-profit zones marked (+784 ticks risk, +4,220 ticks potential reward).
Dynamic Zones: Blue channel and volume-weighted zones provide a context for supply/demand imbalances.
Momentum: RSI recovering from oversold territory with signs of early bullish reversion.
📉 Bottom Pane – RSI Comparison:
MES RSI (Left): Bearish divergence structure leading to local weakness; neutral at ~47.
MNQ RSI (Right): Bullish rebound attempt with higher low in RSI compared to price, suggesting a possible positive divergence.
🧠 Summary:
This setup highlights potential short-term bullish reversals on MNQ1! and trend exhaustion on MES1! using classic pattern recognition (H&S and inverse H&S), custom channel tools, and momentum divergences. Ideal for traders watching high-probability inflection points on U.S. index futures.
⚙️ Designed for educational purposes. Not financial advice.

Neutral environmentThe Friday close on the S&P 500 daily chart created a neutral environment going into a weekend with the least high tension situation. Be prepared for the potential for high volatility.

Quo Vadis - "Where we have come to"Here is is a daily bar chart of the MES1! showing where we have come made up from TV Community scripts. (No coding required.) But the question of course is where do we go from here in light of all the current circumstances: Middle East War, Tariff, Interest Rates, etc Will we see a new All Time High in the S & P 500? This chart does not show a reversal yet. I am staying LONG until the market and the chart says something different.

ES - LONG @ London OpenBuyers from 6000 options level, floor. We've got weak liq. above to squeeze. After London open FIND on smaller timeframes the auction/finished business (risk) and test of pivot/poc (entry)

Sellers maintaining controlSellers maintain control in their shortened S&P 500 daily session. Further movement to the downside would be expected however we are approaching levels the buyers have entered this market previously. So be careful on the short side of this market.


LONG ES after London Open*I like the long better for london open.
From 6000, weak liquidity built up above, Finished business below, macro SMAs buy bias...
HOWEVER there is also a good case for shorts as we are heading up into futures open, SMAs and there is LVN space below to squeeze into. So... I will be looking for finished business RISK and test/acc ENTRY as outlined there and targeting the weak liquidity above. Given the SMAs above etc, i doubt price will rush up, so take your time and get that test to confirm.
And as always if its not there DONT chase. Patience.

06/18/25 Trade Journal, and ES_F Stock Market analysis
EOD accountability report: +521.25
Sleep: 5 hours (bad sleep)
Overall health: My Ultrahuman Ring is saying I might be getting sick. 9 need to recover sleep and take care of body today and tmr. I think my lack of exercise this week is catching up to me.
**What was my initial plan? **
Looking at things premarket, things looked a bit weak as it was about sell off in the morning with bearish structure and DHC. Went in for a short at 1 min MOB but it didn't react and just broke thru, so flipped to bullish side and took it to the next resistance.
overall plan for the day was to look for chop zones to scalp b4 fomc, but that actually didnt happen until after fomc.
** VX Algo System Signals from (9:30am to 2pm)** 4/5
— 9:50 AM Market Structure flipped bullish on VX Algo X3! :check:
— 10:52 AM VXAlgo ES X1 Sell Signal :check:
— 12:10 PM VXAlgo ES X1 Buy signal (Double signal) :x:
— 12:11 PM Market Structure flipped bearish on VX Algo X3! :check:
— 1:40 PM VXAlgo ES X1 Buy signal (Double signal) :check:
Next day plan--> Above 6015 = Bullish, Under 6005= Bearish

Inside day for ThursdayWith the shortened trading session in the S&P 500, the expectation is that Thursday will trade within Wednesday's range.