Sellers are hereSeller showed up on the daily chart in the S&P 500. Typically, with this type of structure follow-through to the downside would be expected. However, with the release of PPI on Thursday it presents the possibility of a daytrading inside of Wednesday's daily range.
WSP1! trade ideas

MES Long - HVN, Gap, FVG, Long trade for MES based on High Volume Node with refined Entry in lower timeframe.
HVN on higher timeframe (daily)
HVN on lower timeframe (m30)
Gap followed by huge FVG
Expected reaction for price to bounce to the upside.
TP2 rather a swing trade exit.
TP1 more of a intraday trade exit.

The Line in the Sand for the entire Post-Liberation Day recoverySince the market traded a double bottom two months ago on the 9th of April, it has rallied over 20% on Trump's backtracking of his foreign policy stance regarding international trade.
Throughout this rally, this trendline has proven to be the only respected structural artifact save for this fixed-range volume profile that serves as the sole area of high liquidity.

S&P500: Within reachThe S&P 500 has edged past the 88.70% retracement and is now trading within our magenta Target Zone (Coordinates: 5,880 points to 6,166 points). This places magenta wave (B) likely near its peak - a move that could soon give way to a sharper decline as part of the anticipated wave (C). At current levels, the setup remains favorable for initiating short positions. To manage risks, a stop just 1% above the upper boundary of the Target Zone is recommended. If the index breaks above resistance at 6,6675 points, however, we would shift to an alternative interpretation: a bullish continuation in the form of the wave alt.(III) in blaue. We currently assign a 40% probability to this scenario. One final note: the minimum technical requirement for wave (B) has already been fulfilled by the entry into the Target Zone. This means wave (C) could begin any time.
Over 190 precises analyses, clear entry points and defined Target Zones - that's what we do.

How to Draw Support & Resistance In TradingViewLearn how to effectively identify, draw, and utilize support and resistance levels in TradingView with this comprehensive step-by-step tutorial. Whether you're a beginner trader or looking to refine your technical analysis skills, this video covers everything you need to know about one of the most fundamental concepts in trading.
What You'll Learn:
Understanding support and resistance: the foundation of technical analysis and price action trading
Step-by-step instructions for drawing horizontal support and resistance lines in TradingView
Creating support and resistance zones for more flexible trading approaches
Practical tips for using TradingView's drawing tools effectively
This tutorial may be helpful for day traders, swing traders, and investors using TradingView who want to improve their chart analysis skills. The techniques covered could help you make more informed entry and exit decisions by understanding where price might find support or encounter resistance.
Visit Optimus Futures to learn more about trading futures with TradingView: optimusfutures.com
Disclaimer:
There is a substantial risk of loss in futures trading. Past performance is not indicative of future results. Please trade only with risk capital. We are not responsible for any third-party links, comments, or content shared on TradingView. Any opinions, links, or messages posted by users on TradingView do not represent our views or recommendations. Please exercise your own judgment and due diligence when engaging with any external content or user commentary.
This video represents the opinion of Optimus Futures and is intended for educational purposes only. Chart interpretations are presented solely to illustrate objective technical concepts and should not be viewed as predictive of future market behavior. In our opinion, charts are analytical tools—not forecasting instruments. Market conditions are constantly evolving, and all trading decisions should be made independently, with careful consideration of individual risk tolerance and financial objectives.

Short SP500 SPYI am net short SPY here. I believe we will cut rates and this will be a sell the news. The market approaches overvalued land yet again. This is why stock picking is so important. I believe we range between 5600-6000 for the next two quarters and we resume a very bullish 2026.

Getting readyThe S&P 500 daily chart is getting ready for fundamentals that will come out on Wednesday. In the Asia session were seeing evidence of selling coming in as the market prepares for Wednesday announcements. This selling could be buyers selling to take profits prior to the fundamentals.

06/10/25 Trade Journal, and ES_F Market analysisEOD accountability report: +2575
Sleep: 9 hours
Overall health: Good
What was my initial plan?
I was neutral going into market open, I expected market to pullback a bit if we had lost 6016 but it never truly got lost.
remained neutral and just watched my levels of 6028 and 6045.
**Daily Trade recap based on VX Algo System from (9:30am to 2pm)**
— 9:30 AM Market Structure flipped bearish on VX Algo X3!
— 10:00 AM VXAlgo YM X3 Sell Signal
— 10:58 AM VXAlgo ES X1 Sell Signal
— 11:32 AM VXAlgo ES X3 Sell Signal (triple sell x3) B+ set up
— 12:00 PM Market Structure flipped bearish on VX Algo X3!
1:03 PM VXAlgo ES X1 Sell Signal
— 1:20 PM VXAlgo ES X1 Sell Signal
Next day plan--> Above 6000 = Bullish, Under 5990 = Bearish
Video Recaps -->https://www.tradingview.com/u/WallSt007/#published-charts

Prepare For A Stock Market Crash
S&P 500 E-mini Futures, Daily Chart.
Potential Ending Diagonal.
Nothing serious. Just a Stop-hunt. But Fast & Furious...
......................................................................................................................
We are not registered or licensed in any jurisdiction whatsoever to provide investing advice or anything of an advisory or consultancy nature.
and are therefore are unqualified to give investment recommendations.
Always do your own research and consult with a licensed investment professional before investing.
This communication is never to be used as the basis of making investment decisions, and it is for entertainment purposes only.

What do we think about this buy after taking Ny liquidity?Looking for buys around this area possibly. Want price to take Ny liquidity and gravitate towards daily fair value gap

AMP Futures - Order types, and how to place a stop on the DOM.In this idea we will cover the different order types you can use in Tradingview, also explaining the placement of the different order types, and how to place a stop order on the DOM.

06/09/25 Trade Journal, and Where is the Stock Market going tomoEOD accountability report: +1800
Sleep: 9 hours
Overall health: Good
What was my initial plan?
Bearish going into the market since we had bearish structure, but missed the short at the start of the market. So just waited for gamma levels to hit orr 1 min MOB to be lost before shorting.
Daily Trade recap based on VX Algo System from (9:30am to 2pm)
— 9:30 AM Market Structure flipped bearish on VX Algo X3!
— 10:20 AM VXAlgo YM X1 Buy Signal,
— 11:00 AM Market Structure flipped bullish on VX Algo X3!
— 1:17 PM VXAlgo NQ X1 Sell Signal (triple sell signal by 1:20)
Next day plan--> Above 6000 = Bullish, Under 5990 = Bearish
Video Recaps -->https://www.tradingview.com/u/WallSt007/#published-charts

A market at easeThe daily structure in the S&P 500 implies balance and a market at ease as it awaits information about the trade talks with the US and China going on in London.

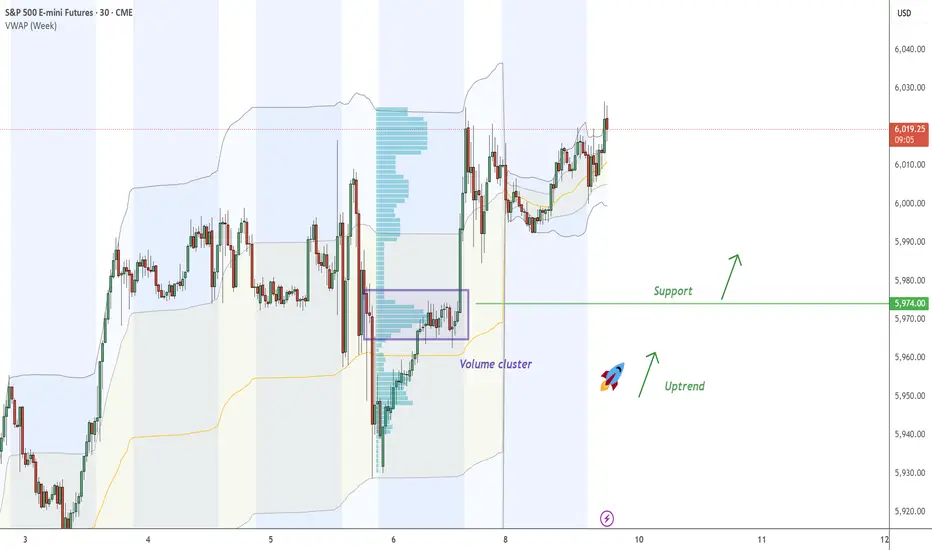
ES - continue with the UptrendOn ES , it's nice to see a strong buying reaction at the price of 5974.00 .
There's a significant accumulation of contracts in this area, indicating strong buyer interest. I believe that buyers who entered at this level will defend their long positions. If the price returns to this area, strong buyers will likely push the market up again.
Uptrend and high volume cluster are the main reasons for my decision to go long on this trade.
Happy trading
Dale
ES Futures-Weekly OutlookCME_MINI:ES1!
Fundamentals and Economic Calendar
Data Recap:
• Friday: 06/06/2025
o US Non-Farm Payrolls (May) 139k vs. Exp. 130k (Prev. 177k, Rev. 147k)
o US Unemployment Rate (May) 4.2% vs. Exp. 4.2% (Prev. 4.2%)
o US Average Earnings YY (May) 3.9% vs. Exp. 3.7% (Prev. 3.8%, Rev. 3.9%)
• Overnight Monday: 06/09/2025
o Chinese Trade Balance (USD)(May) 103.22B vs. Exp. 101.3B (Prev. 96.18B)
o Chinese Exports YY (USD)(May) 4.8% vs. Exp. 5.0% (Prev. 8.1%)
o Chinese Imports YY (USD)(May) -3.4% vs. Exp. -0.9% (Prev. -0.2%)
o Chinese CPI MM (May) -0.2% vs. Exp. -0.2% (Prev. 0.1%)
o Chinese PPI YY (May) -3.3% vs. Exp. -3.2% (Prev. -2.7%)
o Chinese CPI YY (May) -0.1% vs. Exp. -0.2% (Prev. -0.1%)
Looking ahead this week on the calendar, notable economic data releases are as follows:
• Wednesday: 06/11/2025
o US CPI YoY (May)
o US CPI MoM (May)
o US 10 year Note Auction
• Thursday: 06/12/2025
o US PPI MoM (May)
o US PPI YoY (May)
o US 30 year Bond Auction
• Friday: 06/13/2025
o Michigan Consumer Sentiment (Jun)P
o Michigan 1-year and 5-year Inflation Expectations (Jun)P
On the trade and tariff front, we have China-US trade talks continuing in the UK today. The Chinese Vice Premier is visiting the UK from June 8th-13th.
There has been progress made which is visible in terms of China relaxing export controls on rare earth minerals and President Trump stating that they are very far advanced on the China deal ahead of high level talks in London today.
The FED is in a blackout period until the FOMC meeting. Trade, tariffs, and geopolitical risks still need to be monitored.
Technical:
What has the market done?
With NQ leading, ES has also reclaimed yearly open. It held above yearly open in the overnight session.
What is it trying to do?
Climb higher, overlapping bars and yearly VPOC shifting higher denote acceptance at higher prices.
How good of a job is it doing?
Overlapping bars, headline risks and leveraged positions also point towards potential for prices moving lower before resuming higher or remaining range bound. TACO acronym traders may be in for max pain.
What is more likely to happen from here?
Given the data above, we would iterate given our previous explanation that recent data including CPI, PPI, Trade imports, exports is skewed due to trade tensions and this being reflected in business and consumer behavior. FED is likely to remain on hold while it waits and averages out the impact on growth, inflation and labor market.
Scenario 1: Push higher
Prices continue to push higher, if CPI comes in lower than expected, this may prompt a short-term continuation higher.
Scenario 2: Range bound
Markets remain in wait and see mode this week having climbed above yearly open. Markets build value higher and we expect VPOC to shift higher too.
Scenario 3: Sell-off
A mix of factors could e.g., trade talks stalling, weaker than expected US 10 year and 30 year auctions could foreshadow cracks appearing in the bonds market. This may fuel a wider sell-off if yields climb back higher.
Glossary:
ES - emini-S&P 500 Futures
NQ - emini-NASDAQ 100 Futures
VPOC - Volume Point of Control: The most traded price by volume in a given range. Represents acceptance or consensus

Tiqgpt signals for today! Starting with the 1D timeframe, the S&P 500 E-mini Futures have shown a progressive upward movement, indicating a strong bullish market structure. The presence of consecutive bullish candles suggests a dominant buying interest, likely from institutional players. This upward trajectory is supported by the formation of a significant Order Block (OB) around the 5,975 level, which has not been revisited, indicating a lack of mitigation and a strong upward drive.
Drilling down to the 4H timeframe, we observe a consolidation pattern forming just below the 6,000 level, which acts as a psychological round number and potential liquidity pool. The market has made several attempts to breach this level, suggesting an accumulation of buy orders and potential preparation for a liquidity sweep above this zone.
On the 1H chart, the price action has developed a tighter range, oscillating around the 6,004 level. This consolidation near a high indicates a potential inducement zone, where smart money might be trapping retail traders into premature bearish positions before a possible upward expansion.
The 15M timeframe shows a recent Break of Structure (BOS) above the previous high at 6,004, confirming a bullish bias in the lower timeframes. This BOS is crucial as it suggests a shift in market structure favoring continued bullish momentum.
Finally, the 5M chart provides a granular view of the buying pressure. A sharp upward move followed by a small retracement forms a Fair Value Gap (FVG) around 6,004, which has not been filled, indicating that the price might revisit this area to mitigate the imbalance before continuing upwards.
INSTITUTIONAL THESIS:
The overarching smart money intent appears to be targeting the liquidity above the 6,000 level, using it as a springboard for further bullish expansion. The setup across multiple timeframes suggests a coordinated effort to induce bearish sentiment near this key psychological level, only to trap those positions and drive the price higher through a liquidity sweep.

+/-618smack dab in the middle...place your bets, place your bets... come line pays 2x.... 7 craps u outtttt!!!

#es_f $6k holding or we are pulling back cant wait !!main area i am looking for is conf for the $6k area

Mean Reversion + Alternative Long Set-Up MES🔁 MES Mean Reversion Setup – Fade the Gamma Pin
• Trend Bias: Neutral-to-Bearish
• Entry Zone: $6,012–$6,016
• Stop-Loss: $6,020
• TP1 / TP2: $5,998 / $5,985
• R:R Ratio: ~1:2
• Confidence Score: 7.5/10
• Reasoning:
Price is stalling inside top of Fib zone and SpotGamma’s gamma ceiling.
Vol is crushed and mean reversion dominates without fresh upside catalyst.
Clean rejection of 6,012 area intraday offers high-conviction fade down to VWAP zones and liquidity pools under 6,000.
⚠️ Alternative Long Setup – Only on Break + Hold of 6,020
• Trend Bias: Bullish breakout continuation
• Entry Zone: $6,022–$6,025
• Stop-Loss: $6,015
• TP1 / TP2: $6,050 / $6,075
• R:R Ratio: ~1.5:1
• Confidence Score: 6.5/10
• Reasoning:
Would signal breach of gamma wall (unusual without major news).
Requires follow-through volume and tape support from HIRO or strong opening drive.
🧠 Key Notes Going Into the Week:
SPX pinned at 6,000 = no trend yet, just controlled chop.
JPM 5,905 call (June 30 expiry) still anchoring downside gamma. If MES > 6,012 holds on volume, prepare for potential chase.
Next macro catalyst: Wednesday’s CPI (6/11). Until then, expect low realized vol and grind behavior.

Buyers set the toneBuyers set the tone in the Asia session for the S&P 500 daily chart. It implied confidence going into the labor reports on Friday. This confidence carried over to a close above 6000. The next objective to the upside is 6035.

S&P – Bearish outlook, correction coming next week?A lot of chatter recently suggests traders don't trust this rally, I can see why. From both a technical and macro perspective, things are beginning to look shaky.
The S&P 500 is hovering around the psychological 6000 level, moving in and out with little conviction. The index has already broken its first upward trendline, and while it’s attempting to hold a second, momentum appears to be fading.
We’re currently seeing the formation of a rising wedge pattern. More importantly, RSI is diverging from price action, suggesting weakening momentum.
While inflation has come down from its peak, monetary policy remains tight. Rates have been high for a while now, and the effects may be surfacing.
Hiring appears to be slowing. Initial jobless claims have been ticking up for months. Challenger job cuts just spiked above 200K, a level we haven't seen since COVID or 2008.
Interestingly, the recent JOLTS report shows that job openings increased, but quits declined, perhaps suggesting workers are less confident about job-hopping?
Despite this, unemployment held steady at 4.2% today. Historically, unemployment tends to lag Challenger job cuts by a few months, so we could be in for a jump in July or August, similar to the pattern we saw last year, which caused a huge correction.
From a technical standpoint, I’ve entered a small short position here. Momentum is fading, and the wedge breakdown looks interesting. With that said, with macro uncertainty and the possibility of QE-style stimulus returning if economic data worsens, I’m cautious. We’ve seen markets rally on bad news before, especially in crisis environments, like covid times.
The CPI report next week is interesting. If inflation surprises to the upside, the bearish case strengthens. If it cools more than expected, markets might push higher before any real correction.
Interesting times going into summer.

volume profile trading idea test spxthis is a test for my volume profile strategy. the idea is to respect the P shape and the lower side of POC for an uptrend

$SPX trying to break out of the range$ SPX is trying to break out the range, having tested both sides with upside and downside false breakouts.
Choppy action till a decisive breakout happens
