Buying Zone for ES
I'll be watching the 5950 and 5905 areas for a buy signal to the top of the range in the weeks ahead.
WSP1! trade ideas

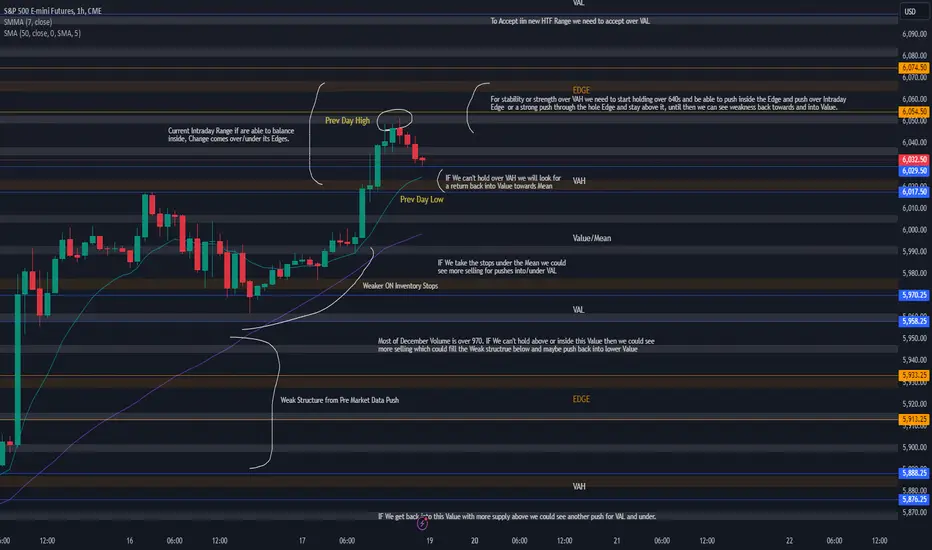
#ES_F Day Trading Prep Week 1.20 - 1.24Market closed outside of Value after failing under 6074 - 54 HTF Edge.
We are set to open inside 6064 - 23 Intraday Range unless market gaps under/over after Mondays Holiday but if we open inside it then that tells us we are over Value and there are two thing we can do here, continue grinding/balancing inside the Intraday Range and try to push towards/into above Edge ?
Or do we find more selling over Value that would bring us back into/under VAH, if we get under VAH we would be under Daily Stops so that could trigger moves towards the Mean/VAL of the range. If we do get back inside the Value we could find support and holds around it BUT careful if we take out out and get under Value, that can bring in more weakness for lower targets where we would watch for any continuation.
IF the strength from last week stays, for us to see any bigger prices out of this HTF Range we would need to hold over VAH and have a strong push into or over the above Edge that would stay over, until then we have December supply trapped over 6050 - 74 so we may stay under this area and most of December Supply is valued over 930 - 70s and we have January month end approaching which means if more size needs to lighten the bag that could trigger some lower destinations.
ES Futures -
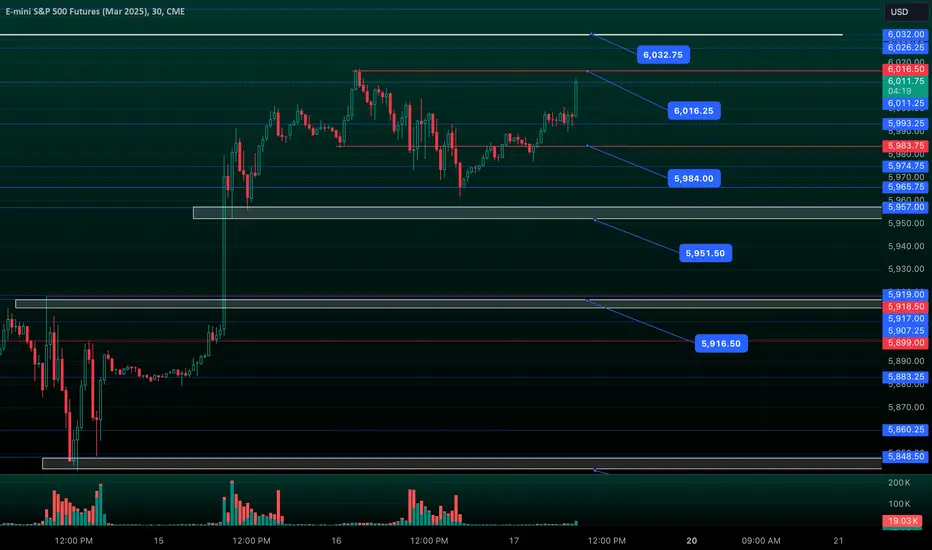
ES Futures Current week Plan ( 19 - Jan -2025 )
ES is currently making HH and HL , I am currently watching for a potential BID Spots .
1st zone - Break and retest of previous High + 50 DMA + Trend line break & retest
2nd zone - PDL sweep + Trend line Support
3rd zone - Break and retest of 14 jan high which is not yet retested
Enter shorts at your own risk and never fight against the trend .

Possible Gold buys, Jan 2025 week 3Last week price failed to break below the previous weeks low.
Price induced relatively equal highs on the daily.
There are 2 FVGs below price that I would like to see price tap into before going to take out the highs.
I'll start looking for buys around 2716.

ES Weekly AnalysisPrice ran into previous FVG on Monday 1/13 creating last weeks weekly low.
Price then blew past a FVG that should've kept price lower which led to a break of structure.
This week I'm looking for price to pull back into this FVG and take price up to fill the FVG from 12/18.
I'm looking to enter around 5900 for the buy.

A look into traderbuddy 2.0 H1 ESFor the 'Real' Market Structure, you might want to follow all timeframe, here we have the H1, where we also are still in a downtrend 9technically and waiting for the rejection of the Extreme to go lower/ or breaking the LH and changing the trend.

M15 'Real' Market StructureFor those who are interested in what we do inside traderbuddy (besides the 28Dto100K Challenge offcourse).
Here is a markup M15 ES with 'Real' Market Structure.
For clarity, offically we are still in a downtrend on the M15 and waiting to see how it will react to the 'Extreme'

Confident closeThe close in the S&P 500 daily chart on Friday was a confident close going into the holiday weekend. Positive movement to the next level is 6060 on the shortened trading session on Monday.

MES!/ES1! Day Trade Plan for 01/17/25MES!/ES1! Day Trade Plan for 01/17/25
📈 6047.25 (NEXT LEVELS: 6066, 6075.5, 6084.75)
📉 5969.75 (CLOSER LEVELS: 6018, 6008.5, 6000)
1/2 way mark 📈 6027.75 & 📉 5989.25
Like and share for more daily ES/NQ levels 🤓📈📉💰
*These levels are derived from comprehensive backtesting and research, demonstrating over 90% accuracy. This statistical foundation suggests that price movements are likely to exceed initial estimates.*

20250117 ESThere was a jigsaw for the AMS. The LOD was made at 4pm. This LOD created the REL. I do not anticipate these REL are to be raided this week.
I would like one more upside subdivision with first d bs level raid. TGIF to start either during AMS sb or PMS Sb. I would like to see ORG as well.
I anticipate some more upside, ideally to see bs raid. Though my main narrative is TGIF. The reversal to the downside is anticipated during AMS SB or PMS SB. I would like to see a clear 2022 model first before making any further judgments. Nevertheless the Wednesday ORG CE level is my -DOL if not for today but for the start of the next week.

ES/SPX Morning Update Jan 17thAt first glance, the market’s final hour yesterday looked bearish. However, for those who dont trade with retail..but trade against retail, things were simple. Just wait for retail to get trapped..aka failed breakdown setups (highlighted in plan for today), it was a clear long opportunity. We dipped below the 5974 and 5966 major zones, trapped shorts as usual, and triggered longs for buyers. Now, just hold runners—no further action needed, approaching our 6016 target. Remember, most professional traders dont trade on Fridays, and i rarely do as well. It's usually just managing runners from Thursday…if i have any. Capital preservation should be your main goal every Friday, with the only set ups being took are textbook failed breakdowns.
ES1 BullishHigher timeframe show bullish momentum price is about to cross over 6000 key level of 15 minute fair value gap was created and held so we took a position anticipating this is the bottom of a 4 hour candle Push

Market Outlook for Next Week (US):The upcoming week features key economic data and events that could influence market sentiment and asset prices. Below are the highlights and their potential market implications:
Key Economic Events & Data Releases
Flash PMIs for January (Tuesday, January 23, 2025)
Time: 9:45 AM EST
Expected Data:
Manufacturing PMI: 49.8 (Previous: 49.5)
Services PMI: 51.3 (Previous: 50.9)
If the Manufacturing PMI remains below 50, it will confirm ongoing contraction in the sector. However, an improvement in Services PMI could suggest resilience in the broader economy. Positive surprises in both PMIs may lead to a rally in equities, particularly in cyclical sectors, while disappointing data could weigh on sentiment.
Initial Jobless Claims (Thursday, January 25, 2025)
Time: 8:30 AM EST
Expected Data: Approximately 215,000 (Previous: 212,000)
A low reading would signal continued strength in the labor market, likely reinforcing expectations for the Federal Reserve to maintain higher interest rates for an extended period. This could put downward pressure on equities while supporting bond yields and the US dollar. Conversely, a higher-than-expected figure may ease rate hike fears and support risk assets.
Q4 2024 GDP Advance Estimate (Thursday, January 25, 2025)
Time: 8:30 AM EST
Expected Growth: 2.2% annualized (Previous: 2.5%)
This release will provide insight into the economy’s performance during the final quarter of 2024. A weaker-than-expected GDP figure could fuel concerns about slowing growth and lead to a rally in bonds, while stronger growth may boost risk appetite but could reignite concerns about further Federal Reserve tightening.
Core PCE Price Index (Friday, January 26, 2025)
Time: 8:30 AM EST
Expected Data: +0.2% month-over-month, 3.6% year-over-year (Previous: 3.8%)
As the Federal Reserve’s preferred measure of inflation, this report will be closely monitored. A decline in the year-over-year figure may reduce pressure on the Fed to hike rates further, which could support equity markets and weaken the US dollar. Conversely, persistently high inflation could trigger renewed concerns about policy tightening, potentially weighing on equities.
Consumer Sentiment Index – Final Reading for January (Friday, January 26, 2025)
Time: 10:00 AM EST
Expected Data: 64.8 (Previous: 64.6 preliminary)
Consumer sentiment is a key indicator of household confidence and spending outlooks. An improvement could support consumer-related stocks, while any downward revision might weigh on the market.
Overall Market Implications
Equity markets will likely remain sensitive to any data hinting at changes in economic growth, inflation, or labor market conditions. Positive surprises in growth or inflation cooling could drive risk-on sentiment, while signs of a slowing economy or stubborn inflation might increase market volatility. Bond markets may see notable movement depending on the GDP and Core PCE figures, while the US dollar’s trajectory will largely depend on labor market and inflation data.
Investors should prepare for potential volatility across sectors, particularly in interest rate-sensitive areas like technology and real estate.

Sideways moveThe expectation for the Friday movement on the daily chart for the S&P 500 is a sideways move. Thursdays price action implies the possibility of profit-taking. If this is the case that means follow-through to the downside would not be typical.

AMP Futures - How to access Futures optionsIn this idea we will demonstrate how to access Futures options using the Tradingview platform.

MES!/ES1! Day Trade Plan for 01/16/25MES!/ES1! Day Trade Plan for 01/16/25
📈 6060
📉 5940
1/2 way mark 📈 6031 & 📉 5969
Like and share for more daily ES/NQ levels 🤓
*These levels are derived from comprehensive backtesting and research, demonstrating over 90% accuracy. This statistical foundation suggests that price movements are likely to exceed initial estimates.*
