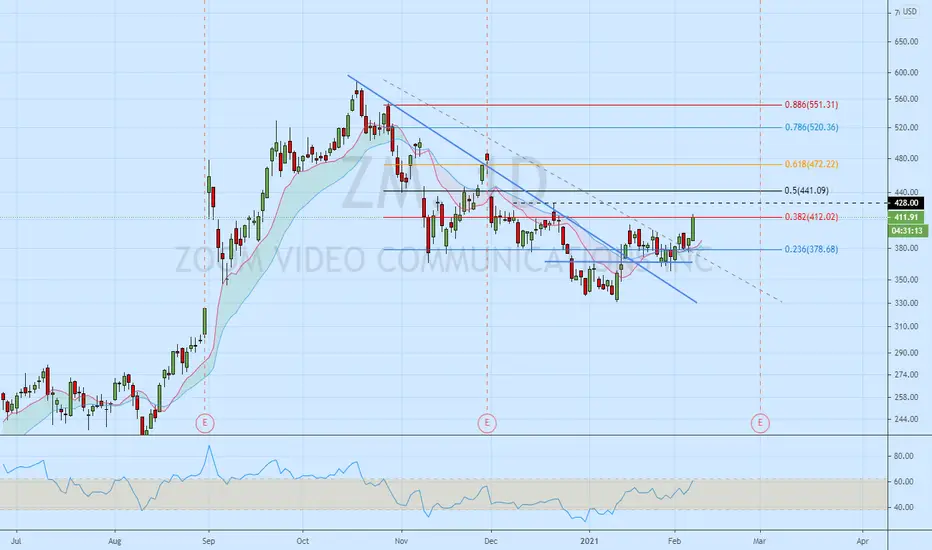
ZM 382 break on watchI am still in this trade from my initial post on on Dec 29. Check out the two posts below. We now have another opportunity to enter or add to an existing position. Price has run up into 382 fib resistance. If price can consolidate here and break above 412.. a push to 425/440 and 470 is possible. ZM has earnings on Mar 1st which may provide a longer term momentum catalyst. ZM is also held in two ARK funds which provides conviction for many trader/investors.
Additional Info:
I am an intraday scalper and short term swing trader of stocks & Futures using options and equity.
I focus on high volume momentum stocks in strong uptrends.
My time frame is between 5minutes to 5 days on most trades.
I scale into positions and scale out of positions as my targets are hit.
I always trail my stops after T1 is hit to reduce risk and lock in gains.
If my post is on a Weekly/Daily/240M chart the idea is a swing trade.
If my post is on a 60M chart or lower the idea is a day trade.
Day trades can turn into swing trades if the stock is strong.
All trades should be supported by market direction.
Treat my posts as trade ideas and not signals.
Traders must trade using their own back tested trade plan and rules.
Traders must plan risk first and profits second.
Happy Trading!
Z1OM34 trade ideas

Zoom Swing If we can hold the 430 area, we can expect a gap fill to around 445. We did see an inverse head and shoulders pattern play out and were sitting at the neckline.

ZM entriesSecond entry on ZM today marked by black line. Bought on pullback. Will hold until trend changes. Until then I move my stops up on a weekly basis.

Zoom Zoom Zoom, Are you Ready?Daily chart has been on a slight downtrend which on the higher time frame (Weekly Chart) shows a slight consolidation cycle into the higher time frame. Price action has reverted back to its mean on the Daily which is the 150 SMA, which reflects the higher time frame middle BB. Weekly chart still in tact as far as an uptrend, daily chart has broken out of its consolidation cycle and beginning to set up for another leg up.

For ZM Bull: We need to hold the line at $486 to take overZM needs to pass $433 first and stay strong above $475 then we will see ZM going to pass ATH

Just a quick ideaRight now would be a good entry point, since this is the new way companies and businesses are communicating with their employees this might be a good long term investment

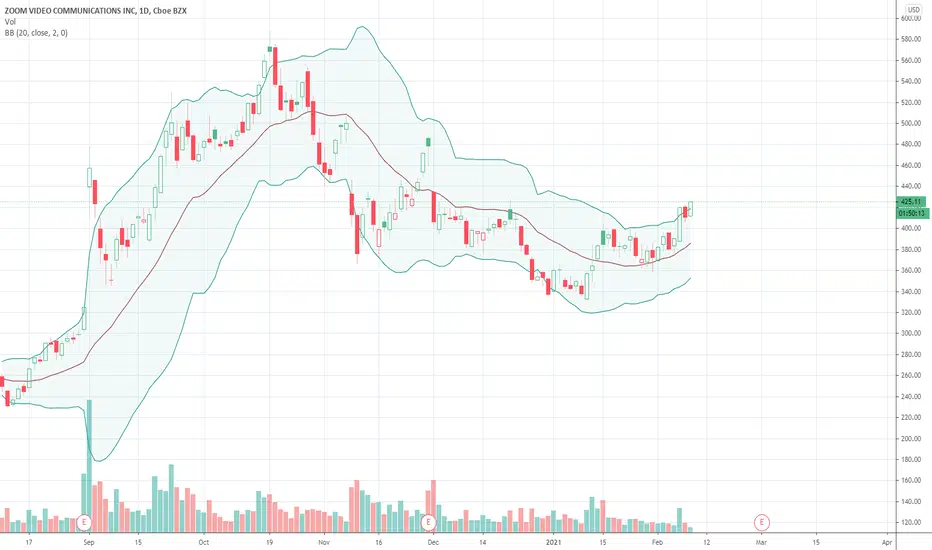
Dunno May be Close to Landing PadWeekly chart. Weekly charts often show you the true angle of the run up (or monthly)
If this is a parabolic arc pattern, most pull back 50% to 62% during correction mode, or somewhere in between as well. It is possible to fall back deeper. Arc patterns do not usually "Blast off" when they hit their level either as other stocks hit a sweet spot and Boom, off they go. Patience would be required perhaps as zoom had a steep rise up..
If this is an arc pattern, there can be volatility for an extended amount of time..
Just an observation and not a recommendation


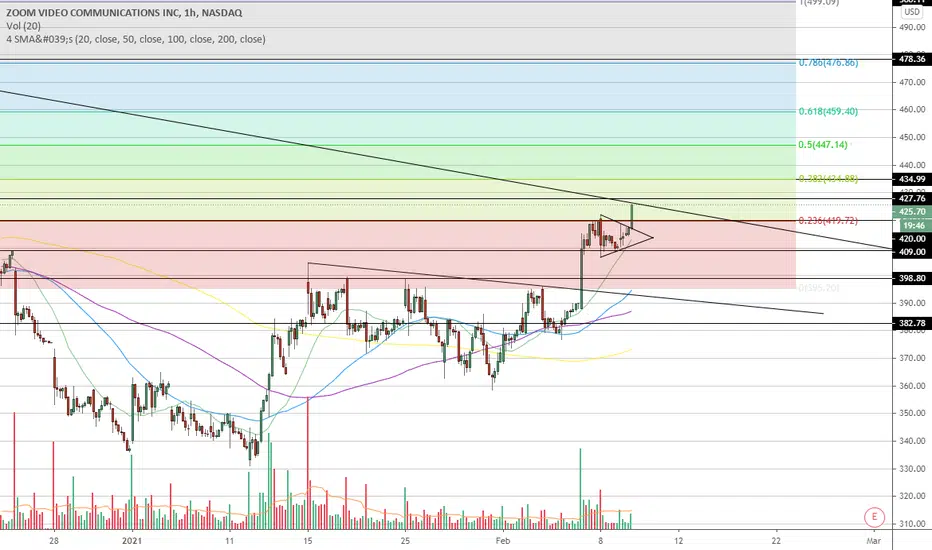
Watching for continuationWe caught some great lottos on Friday, tomorrow watch where this opens, if it gaps up to trendline watch for pullback to yesterdays HOD or 409. From there I think it will try and test that trendline.


Bullish on ZM target 600-700 by March-AprilMid-term target 600-700 on ZM
Short term target for February 460-480
Key pivot: 420
Targets above 420 are 434, 450, 460, 480
This monster is about to wake up.
Broke out of a flag Friday, we either see continuation Monday or a pullback to retest the breakout.


Zoom Breaking out of downward channelI'm a noob and would like some feed back on this daily chart set-up and analysis. To me looks it like zm has broken out its downward channel since october highs, broken a little resistance at $400 and has momentum going into earnings on 3/1/21, possible entry on the next pullback? Feed back and criticism would be greatly appreciated. Thank you.


ZM - February 6, 2021ZM has finally broken the long downtrend put in from October with volume. After a touch of the 200 day EMA, ZM can continue higher on a strong trend to test ATH in the coming months. Earnings are expected to be in early March which can act as a catalyst for pushing the stock higher.

