Alibaba - This chart is pretty bullish!🎁Alibaba ( NYSE:BABA ) will head much higher:
🔎Analysis summary:
After we saw the perfect creation of the rounding bottom on Alibaba, the trend finally shifted back to bullish. Especially with the recent bullish break and retest, Alibaba is now preparing for another major move higher. All we need now is simple bullish confirmation.
📝Levels to watch:
$140
SwingTraderPhil
SwingTrading.Simplified. | Investing.Simplified. | #LONGTERMVISION
9988/N trade ideas

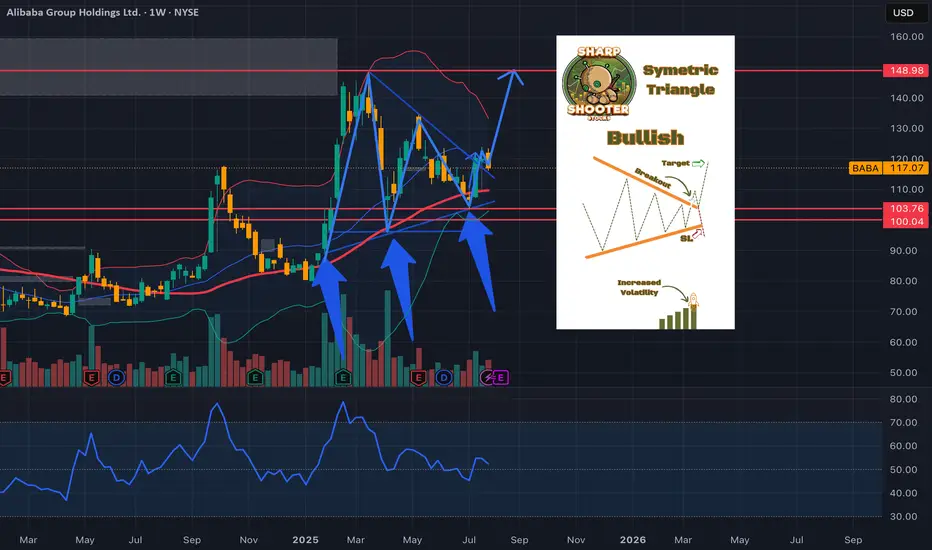
BABA could BREAKOUT back to ALL TIME HIGHS!I believe NYSE:BABA is priming up for a breakout, returning to All-Time Highs and possibly Higher!
- Technicals: Break and Retest (Symmetric Triangle)
- Upcoming Earnings: August 14th
- Potential Catalyst: US / China Trade Deal or Extension
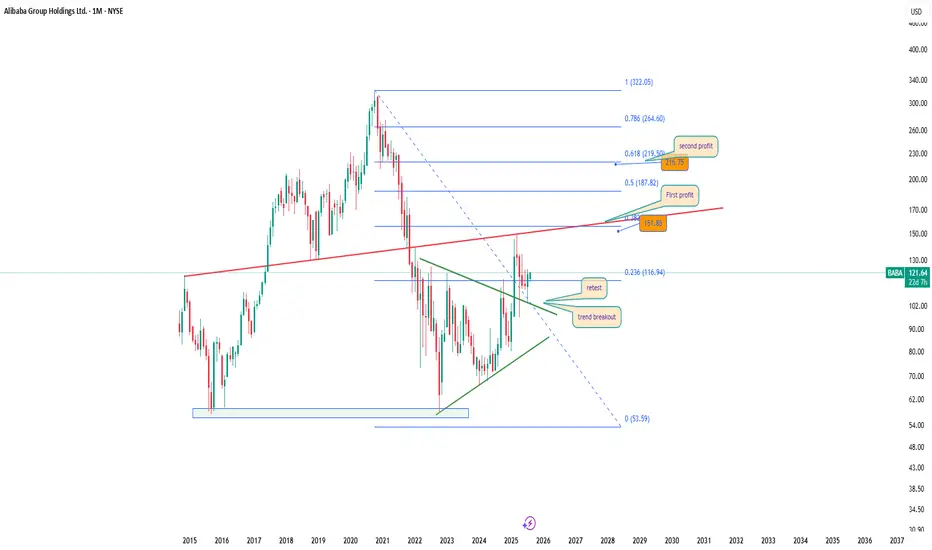
BABA 1M: Chinese favorite rising againTechnical setup:
Breakout from long-term triangle
Retest of trendline confirmed
Price holds above Fibo 0.236 (116.94)
First resistance: 151.85
Fibo targets:
→ 0.5: 187.82
→ 0.618: 219.50
Trade plan:
→ Hold after successful retest
→ Add on dips to 116–118
Targets: 151.85 / 187.82 / 219.50
Fundamentals:
Alibaba is restructuring around cloud and AI. Regulatory pressure from China is easing, and earnings are stabilizing. Buybacks and renewed institutional interest provide strong mid-term support.
Conclusion:
Alibaba may fall seven times, but rise eight — especially when Fibo and price action agree.
BABA Daily Trade SetupsIn this update we review the recent price action in Alibaba and identify the next high-probability trading opportunity and price objectives to target. To review today's video analysis clcik here!

BABA – Cup and Handle Breakout with First HH/HLNYSE: BABA is forming a cup and handle pattern, with price breaking above the previous lower high, marking the first higher high and higher low in this potential trend reversal. Structure is turning bullish with momentum building.
BABA WEDGEalthough baba has a gap to fill above and below, it's showing strength, wedging, volumes coming back in, and million in call flow were placed yesterday. It's been chopping tightly for a bit now on the daily chart on low volume, but as the volume is starting to come back in, earnings coming up, and other bullish sentiment, I'm leaning towards a BABA breakout soon towards the 130s. Nfa
BABA Long UpdateAlibaba Setup & Bullish Thesis
BABA remains held up in a low-volume node, which has historically acted as a headwind to price momentum. However, accumulation volume patterns are forming, and the weekly chart structure is in harmony with a move higher. Really likeing the breakout on the micro and holding it with an inside week candle, Clean break through 124 area with volume sends it, the first target is $150, with potential for $180+ if price can traverse the low-volume area above. Notably, this level aligns with major Fibonacci confluences, strengthening the technical case. Lets let earnings send it.
Fundamental Tailwinds
1. Strong AI Push
Launched Amap 2025, the world’s largest AI-native map platform
Entered the AI wearables space with smart glasses to compete with Meta, signaling ambition in next-gen consumer AI
2. Analyst & Investor Support
Analysts at Benchmark and Bank of America continue to maintain Buy ratings
Featured by Motley Fool and Zacks as a top stock to accumulate on pullbacks
3. Macro Tailwinds
U.S. easing chip restrictions benefits Alibaba Cloud and AI expansion
China tech rebound and the broader AI growth narrative are key catalysts supporting further upside
BABA: We have a bounce but is it temporary? Too many questions but dss forecasts a price growth near-term on ticker symbol $BABA. We will see where it goes. Another one on the watch is NASDAQ:PDD
Alibaba - A remarkable reversal!🛒Alibaba ( NYSE:BABA ) reversed exactly here:
🔎Analysis summary:
Recently Alibaba has perfectly been respecting market structure. With the current bullish break and retest playing out, there is a very high chance that Alibaba will rally at least another +20%. But all of this chart behaviour just looks like we will witness a major bottom formation soon.
📝Levels to watch:
$110, $135
🙏🏻#LONGTERMVISION
Philip - Swing Trader

New Setup : $BABAInside this wedge there is a nice pullback to the ema 50.
Bullish ATR Break popped out with a new crossover.
Ready To Catch It !

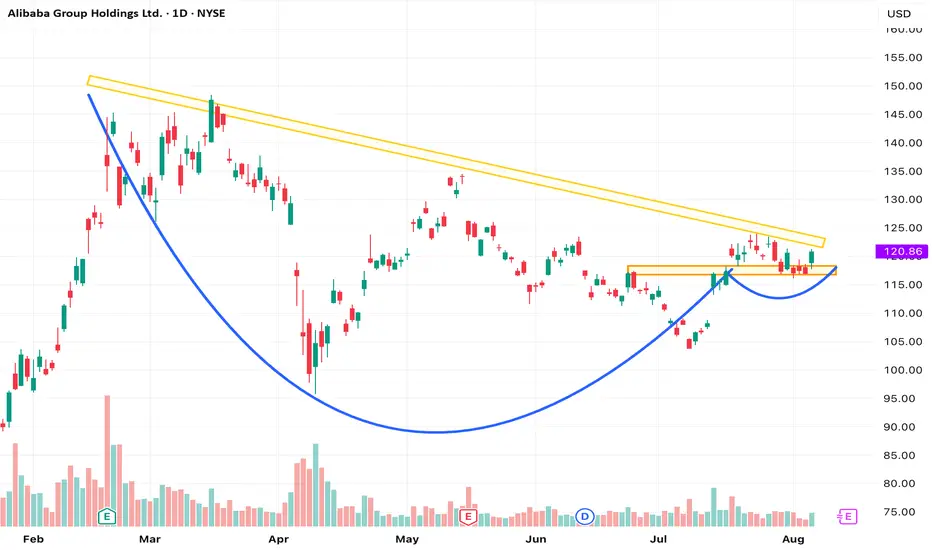
Much needed break for $BABA on the horizonI took a much needed break but not as long as NYSE:BABA has taken since 2021; swinging between ~$70 and ~$120 over the past six years.
I strongly suspect that this might have something to do with Jack Ma's speech in late 2024 that made him go 'missing' from public view
- www.wired.com .
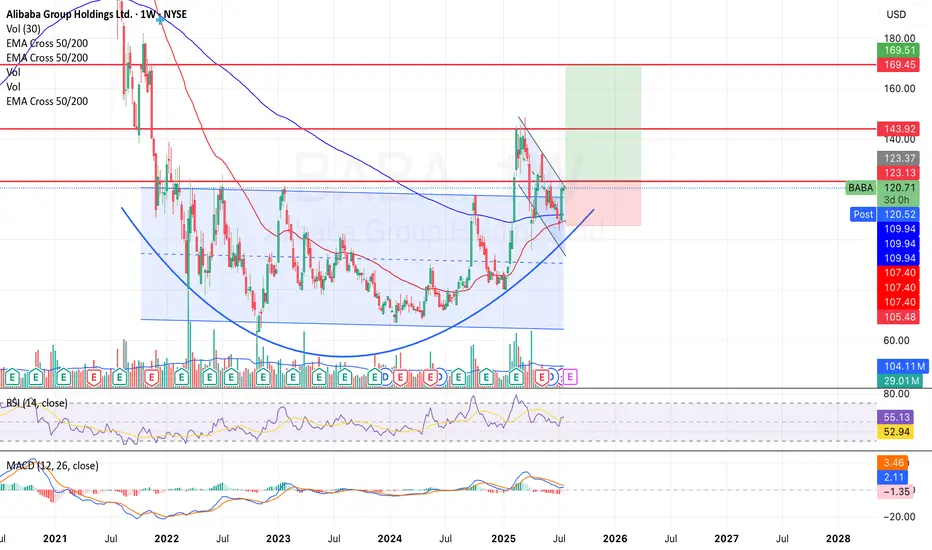
The stock has formed a multi-year rounded bottom (cup) followed by a handle formation, a classic bullish reversal pattern. Price is currently consolidating just below the ~$123 resistance with a potential target of $143 - $170 if this breaks resistance.
I will hedge my bets on a bullish run and find support around $107 - $109 if the breakout is rejected.
NYSE:BABA is currently trading above the 50 and 200-week EMA and I see a potential golden cross forming in the coming days.
U.S - China relations still proves challenging but with earnings on the horizon I am optimistic that it will be the catalyst for this breakout.
BABA looks ready to drop.It’s been hitting the $125 wall since May and just can’t break it. This last bounce? Weak volume. No real buyers stepping in. RSI is already stretched and there’s no accumulation from big players.
If it loses $120 with conviction, we might see $110 or lower.
And let’s be real — China’s still struggling and the narrative isn’t exciting anyone anymore.
I’m eyeing a PUT. If it breaks $125 clean, I’ll flip my view. Until then… watch out.
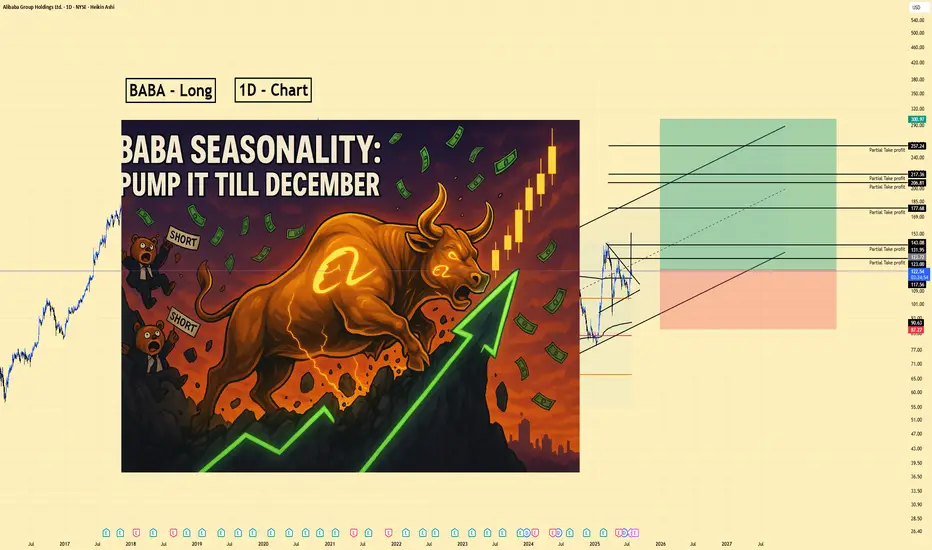
BABA | Long | Strong AI & Seasonality Tailwinds (July 2025)BABA | Long | Strong AI & Seasonality Tailwinds (Aug 2025)
1️⃣ Quick Insight: Alibaba is showing strong AI-driven momentum, healthy fundamentals, and positive seasonality patterns. August–December tends to be bullish, and the stock is already holding up well despite recent dips.
2️⃣ Trade Parameters:
Bias: Long
Entry: Current price zone (~$123)
Stop Loss: $87
Take Profits:
TP1: $131
TP2: $143
TP3: $177
TP4: $206
TP5: $217
TP6: $257
Extended Target: $300 (if momentum holds through the parallel channel)
3️⃣ Key Notes:
Alibaba’s fundamentals remain solid with revenue up on a yearly basis since 2021, even though some quarters have shown pressure. EPS is expected to grow annually, and institutional interest is strong (43% holding increase by Maridea Wealth Management). The AI pivot with Qwen LLM models and Quark AI glasses launch could be major catalysts. Seasonality supports upside through mid-December before potential reversals.
4️⃣ What to Watch:
AI & cloud revenue performance (Qwen adoption)
Cainiao and other potential spinoff IPOs
Regulatory updates and U.S.-China tensions
Seasonal strength: historically bullish until late November–early December
📊 Outlook: Analysts forecast $150–$160 in the next 12 months (~20–30% upside). Bull case targets range $200–$250 over 3–5 years, with potential extension if AI & international commerce expansions deliver.
Please LIKE 👍, FOLLOW ✅, SHARE 🙌 and COMMENT ✍ if you enjoy this idea! Also share your ideas and charts in the comments section below! This is best way to keep it relevant, support us, keep the content here free and allow the idea to reach as many people as possible.
Disclaimer: This is not financial advice. Always do your own research.
Baba - Waking GiantIt was trading at 300 levels during the 2020. Compare the EPS and sales with 2020 and 2025, there is a growth but the stock price has been trending down.
But from 2024, it has started the reversal and its trying to break the trend line.
Its 4th largest cloud provider world wide and its AI model Qwen gained traction with lots of downloads recently.
Target 1: 155$
Target 2: 210$
Stop loss: $90
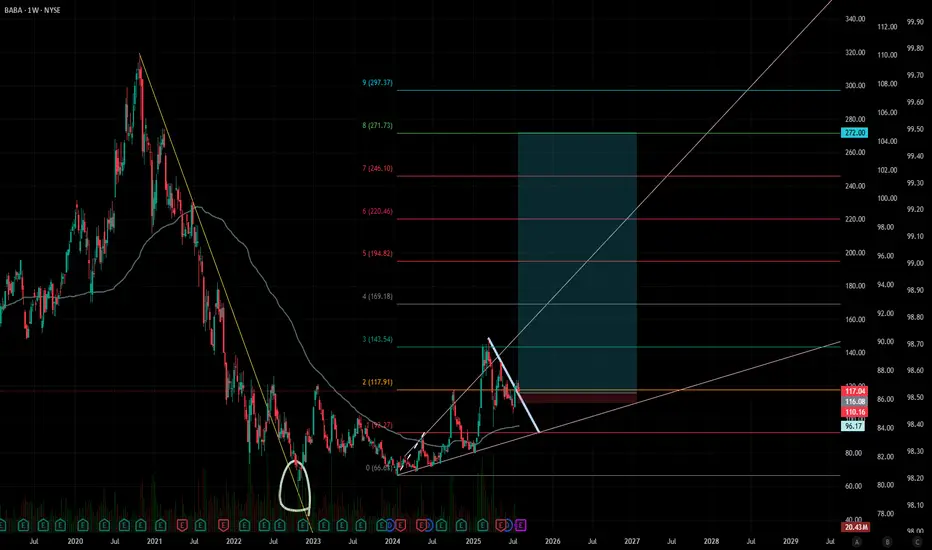
BABA - Livermore's Speculative Chart Method Analysis
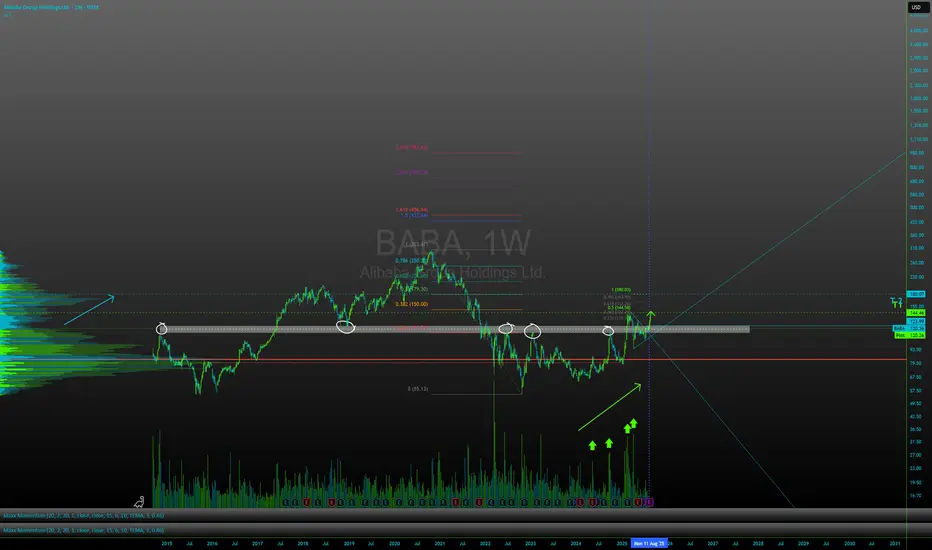
📊 Analysis Summary:
BABA (Alibaba) weekly chart shows completion of a 2+ year markdown phase and is currently forming what Jesse Livermore described as an "Accumulation Cylinder." The stock is now approaching a critical "Pivotal Point" that could signal transition into a major markup phase.
🔍 Analysis Phases:
**Markdown & Accumulation Stage:**
- Clear downtrend established from late 2020 highs
- Late 2022: Capitulation bottom formed with volume spike (white circle), initiating the "Accumulation Cylinder" phase
- During this period, stock quietly transferred from weak hands to strong hands, building a solid foundation
**Pivotal Point - Current Situation:**
- Price has broken above the major downtrend line
- Currently showing bull flag/pennant consolidation pattern (white declining trendline)
- Decisive breakout above this consolidation resistance represents Livermore's "The All-Important Action" - the key confirmation signal for new uptrend initiation
**Markup Phase & Targets:**
- Successful pivot point breakout should trigger the primary "Markup" phase
- Fibonacci-based targets (Levels 1-9) map the potential upside trajectory
- Ultimate target: **~$272 level (Level 8)** based on this analysis
- Following Livermore's strategy: Hold positions while trend persists, reassess on meaningful corrections
⚠️ **Risk Management:**
Monitor for failure to maintain stepped progression pattern that Livermore emphasized as critical for sustained major moves.
**Disclaimer:** This analysis is based on Jesse Livermore's theoretical framework for educational purposes and is not investment advice. All investment decisions are your own responsibility.
#Livermore #BABA #SpeculativeChart #TechnicalAnalysis #ClassicTA
Long $BABA - NYSE:BABA is testing 200 SMA
- NYSE:BABA moves are explodes higher then cools then retest support then explodes higher than the last high. It's called trading with higher wavelength
-> Move 1: Started April 2024 when the trend reversal started. $68 -> $89 with around +30% then retraced $90 -> $72 ( -20% )
-> Move 2: July 2024, $72 -> $116 (+61%) then retraced $116 -> $80 ( -31% )
-> Move 3: Jan 2025, $80 -> $146 (+ 82.5%) then retraced $146 -> $108?? ( correction underway ) ~ -26% so far
-> Move 4: Likely from $100-105 to $180-200

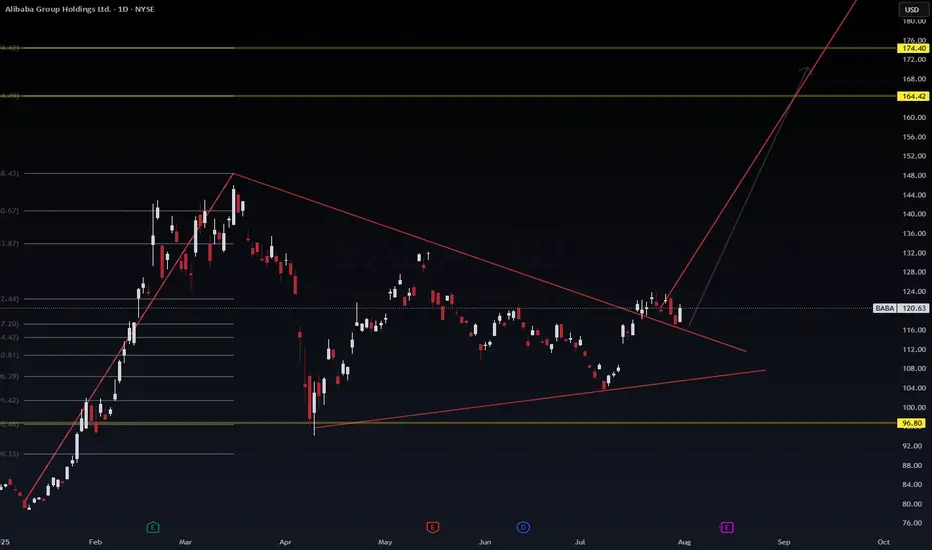
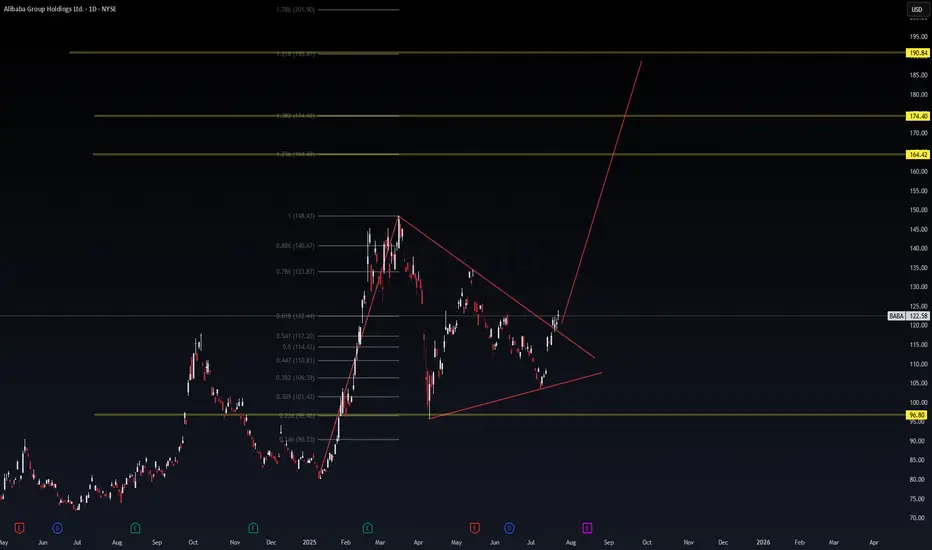
$BABA Breakout Imminent – Triangle Compression Ending, Fib .....📈 NYSE:BABA Breakout Imminent – Triangle Compression Ending, Fib Confluence Targets Set
After weeks of coiling inside a converging triangle, Alibaba ( NYSE:BABA ) just broke above the downtrend line with conviction. The structure and Fibonacci extensions point toward an explosive leg up—possibly targeting $164 → $174 → $190.
🔺 Setup Breakdown (Daily Chart)
Price: $122.58
Breakout confirmed above triangle resistance
Strong volume into the 0.618 Fib zone (from recent swing)
Measured move extension targets:
🟨 1.236 = $164.42
🟨 1.382 = $174.40
🟨 1.618 = $190.84
🧠 Macro Overlay (VolanX Protocol)
China stimulus whispers + tech rotation = alpha setup
Liquidity expansion in HK/US dual-listed names
Institutional buy zones aligning with breakout levels
🎯 WaverVanir Playbook
Entry: $121–123 (breakout retest range)
Stop: Below $117
Target 1: $164
Target 2: $174
Optional: Long Call Spread (e.g., $130/$160 for Sept)
This is a DSS-confirmed breakout model—not financial advice. Track it. Learn from it. Execute with clarity.
—
🔻 #VolanX #WaverVanir #BABA #BreakoutPlay #ChinaTech #FibonacciTrading #TradingView #SwingTrade #OptionsFlow #TrianglePattern #MacroCatalyst #QuantFinance #PredictiveTrading #InstitutionalSetups
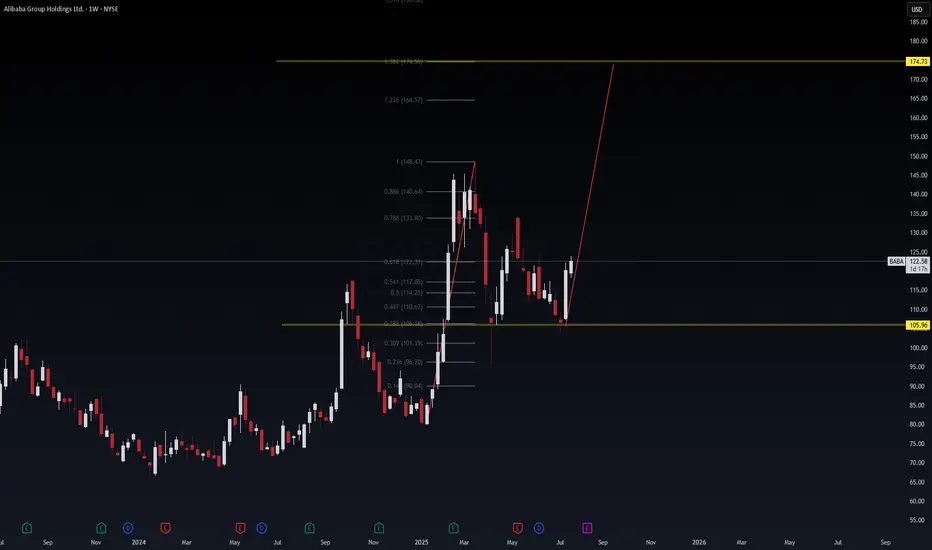
BABA | Weekly VolanX Setup📈 BABA | Weekly VolanX Setup
WaverVanir International LLC | July 24, 2025
Alibaba is bouncing off a key institutional demand zone at 105.96, reclaiming the .382 Fibonacci level with strong bullish conviction. This weekly structure sets the stage for a macro Fibonacci extension run toward 174.73 — a 1.618 projection from the March 2024 low to the March 2025 high.
🧠 VolanX Signal Context:
🔂 Structure: Double bottom + rejection wick off golden zone
🔺 Fib Targets: 133.80 → 140.64 → 164.57 → Final at 174.73
🏹 Strategy: Spot or ITM Call LEAPS (Jan/Jun 2026) or 0.50 Delta options ladder
🧭 Thesis: China tech revival, undervaluation vs U.S. peers, potential stimulus
🧨 Risk: Invalid below 105.96 weekly close. Next support 101 → 96
📡 VolanX Protocol Notes:
DSS Score: 8.6/10
Macro Tailwind: Fed dovish bias + U.S. tech overbought rotation
Position Type: Swing accumulation (8–12 week hold)
Optional Overlay: Long NYSE:BABA , short AMEX:KWEB or FXI for cleaner exposure
🛡️ Not Financial Advice. For informational and educational purposes only.
VolanX is an AI-governed trading system under WaverVanir International LLC.
#Alibaba #BABA #VolanX #MacroTrading #Fibonacci #ChinaTech #WaverVanir #DSS #InstitutionalTrading #TradingView #OptionsFlow #SMC #VolanXProtocol
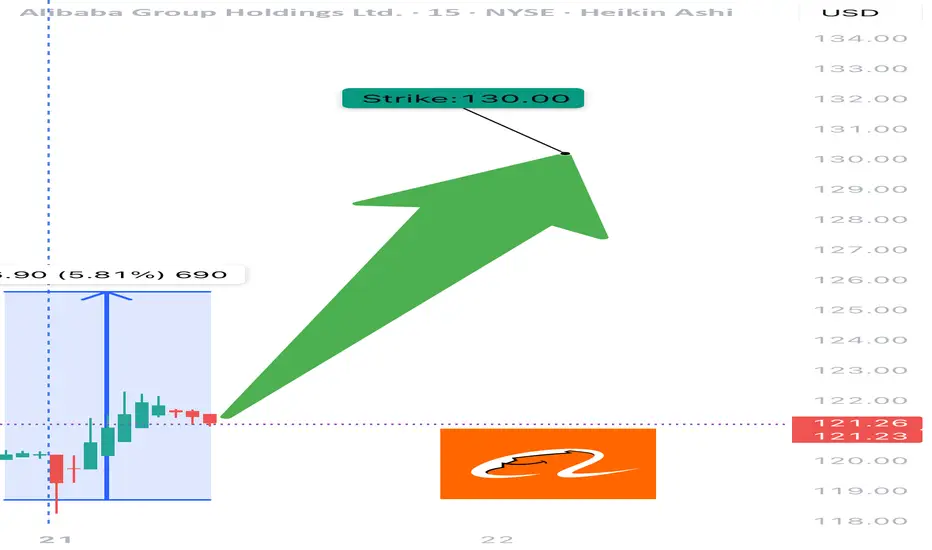
BABA WEEKLY TRADE IDEA – JULY 21, 2025
🐉 NYSE:BABA WEEKLY TRADE IDEA – JULY 21, 2025 🐉
📈 Strong RSI. Institutional Accumulation. Gamma-juiced upside.
Momentum is building — timing is key.
⸻
📊 Trade Setup
🔹 Type: Long Call
🎯 Strike: $130.00
📆 Expiry: July 25, 2025 (4 DTE)
💰 Entry Price: $0.52
🎯 Profit Target: $0.74 (📈 +42%)
🛑 Stop Loss: $0.30 (~40% Risk)
📈 Confidence: 70%
🕰️ Timing: Enter at Monday Open
📦 Size: 1 Contract (or scale accordingly)
⸻
🔍 Why This Trade?
✅ Daily RSI = 68.3 → Bullish momentum building
✅ Volume = 1.3x week-over-week → Institutional buying confirmed
📊 Neutral Call/Put Flow → Sentiment not overheated = better entry
🧠 Multiple models agree on MODERATE BULLISH bias
🌬️ VIX stable = ideal for controlled option premium entries
💎 Gamma risk manageable, but monitor price spikes at resistance near $130–132
⸻
⚠️ Risk Management Notes
🔸 RSI near breakout zone → monitor for fakeouts
⏳ Only 4 days to expiry → time decay risk accelerates
📉 Watch for rejection near key levels ($130.50–132.00)
🛑 Respect the stop: If momentum stalls early, exit fast
⸻
📌 Execution Strategy
🔹 Enter clean, single-leg naked call
🔹 Exit partial at 30% profit, full by Thursday unless breakout is strong
🔹 Avoid spreads: delta exposure preferred for upside spike capture
⸻
🏁 Verdict:
All models point to upside, but not full conviction.
This is a momentum + positioning trade, not a breakout gamble.
NYSE:BABA 130C – Risk $0.30 to Target $0.74 📈
Tight structure. Moderate aggression. Execute with precision.
⸻
#BABA #OptionsTrading #CallOption #WeeklyTrade #MomentumPlay #UnusualOptionsActivity #TradingViewIdeas #GammaFlow #FlowBasedSetup #Alibaba
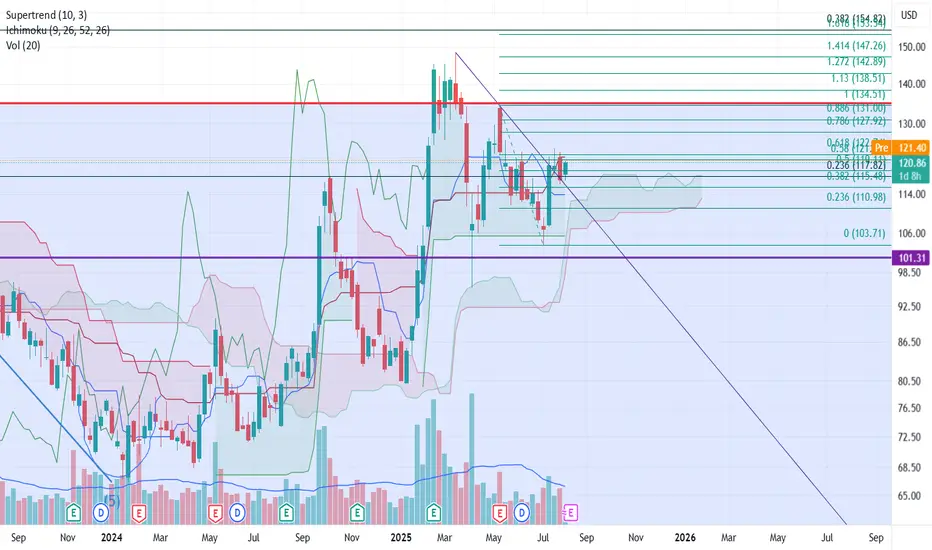
BABA is a BUY BUYDowntrend break in play, wedge forming. We should break through resistance of 128 and test all time highs in high $140's in the next few weeks

BABA: triangle with tensionOn the weekly chart, BABA has already formed a golden cross - price is above both MA50 and MA200, confirming a bullish trend shift. The stock is now approaching the upper edge of the symmetrical triangle and the key resistance at $122, which also aligns with the 0.5 Fibonacci level.
The numbers inside the triangle represent the contraction phases, not Elliott waves. This is a classical consolidation before a potential breakout. If the $122 level is broken and retested, upside targets are $128 (0.618), $137 (0.786), and eventually $148–181 (1.0–1.618 extension).
Volume is rising, MACD is flipping bullish, and RSI is climbing out of oversold territory — all signs point to growing bullish momentum.
Fundamentally, Alibaba benefits from China's economic rebound, possible regulatory relief, and ongoing share buybacks. With Chinese tech rotating back into favor, BABA could lead the rally.
So if you're still waiting for a signal - it's already here. The golden cross is done, price is flying above moving averages, and all that’s left is a clean breakout. Watch $122 — that’s the launchpad.

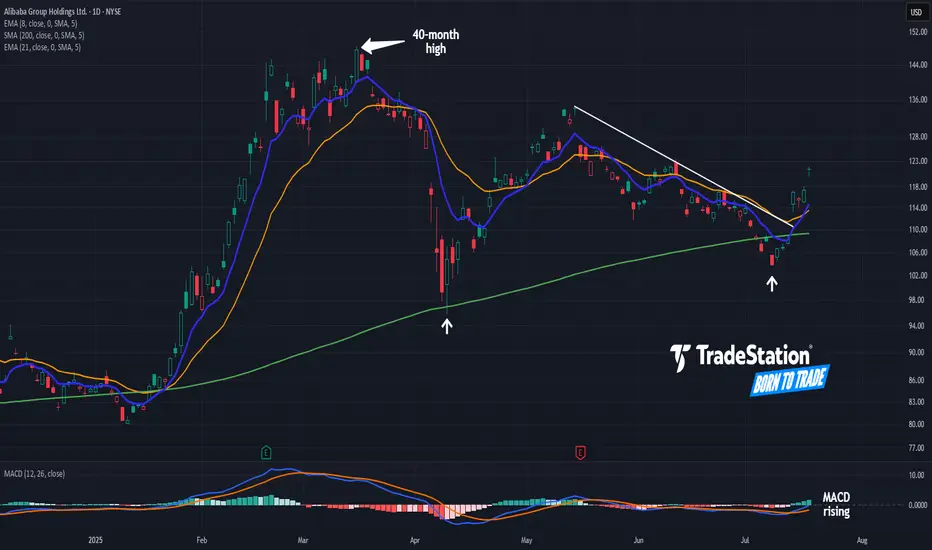
Alibaba Breaks a TrendlineAlibaba began 2025 with a big rally. Now, after a long pullback, some traders may see further upside in the Chinese tech giant.
The first pattern on today’s chart is the pair of higher lows (marked with white arrows) along the rising 200-day simple moving average. Those may reflect the development of a longer-term uptrend.
Second, BABA peaked above $148 in March. It was the highest price since November 2021. That may suggest a long-term downtrend is fading.
Third is the series of lower highs in May and June. The stock broke that falling trendline this week, a potential sign of improving price action in the short term.
Next, MACD is rising and the 8-day exponential moving average is nearing a potential cross above the 21-day EMA. Those could be viewed as further positive short-term signals.
Finally, BABA is an active underlier in the options market. (Volumes have averaged more than 200,000 contracts per session in the last month, according to TradeStation data.) That may help traders take positions with calls and puts.
TradeStation has, for decades, advanced the trading industry, providing access to stocks, options and futures. If you're born to trade, we could be for you. See our Overview for more.
Past performance, whether actual or indicated by historical tests of strategies, is no guarantee of future performance or success. There is a possibility that you may sustain a loss equal to or greater than your entire investment regardless of which asset class you trade (equities, options or futures); therefore, you should not invest or risk money that you cannot afford to lose. Online trading is not suitable for all investors. View the document titled Characteristics and Risks of Standardized Options at www.TradeStation.com . Before trading any asset class, customers must read the relevant risk disclosure statements on www.TradeStation.com . System access and trade placement and execution may be delayed or fail due to market volatility and volume, quote delays, system and software errors, Internet traffic, outages and other factors.
Securities and futures trading is offered to self-directed customers by TradeStation Securities, Inc., a broker-dealer registered with the Securities and Exchange Commission and a futures commission merchant licensed with the Commodity Futures Trading Commission). TradeStation Securities is a member of the Financial Industry Regulatory Authority, the National Futures Association, and a number of exchanges.
Options trading is not suitable for all investors. Your TradeStation Securities’ account application to trade options will be considered and approved or disapproved based on all relevant factors, including your trading experience. See www.TradeStation.com . Visit www.TradeStation.com for full details on the costs and fees associated with options.
Margin trading involves risks, and it is important that you fully understand those risks before trading on margin. The Margin Disclosure Statement outlines many of those risks, including that you can lose more funds than you deposit in your margin account; your brokerage firm can force the sale of securities in your account; your brokerage firm can sell your securities without contacting you; and you are not entitled to an extension of time on a margin call. Review the Margin Disclosure Statement at www.TradeStation.com .
TradeStation Securities, Inc. and TradeStation Technologies, Inc. are each wholly owned subsidiaries of TradeStation Group, Inc., both operating, and providing products and services, under the TradeStation brand and trademark. When applying for, or purchasing, accounts, subscriptions, products and services, it is important that you know which company you will be dealing with. Visit www.TradeStation.com for further important information explaining what this means.
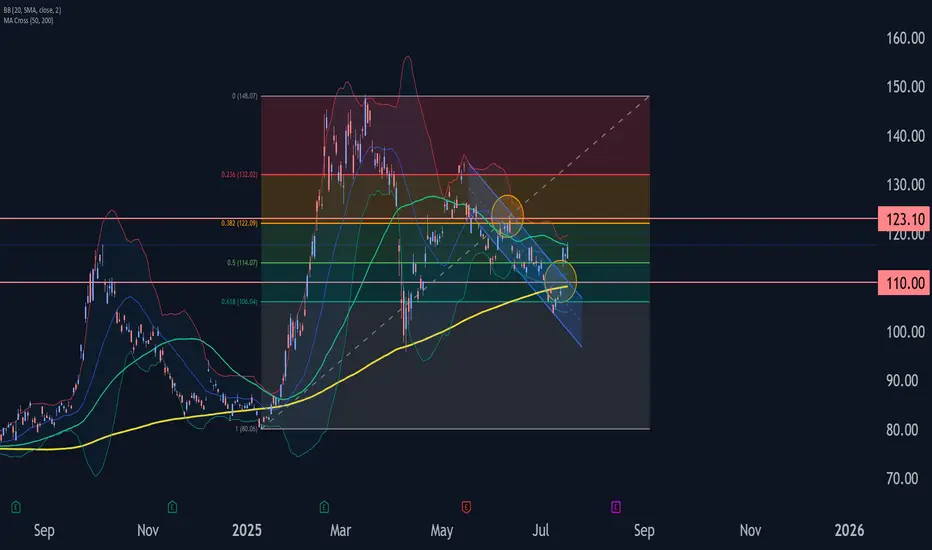
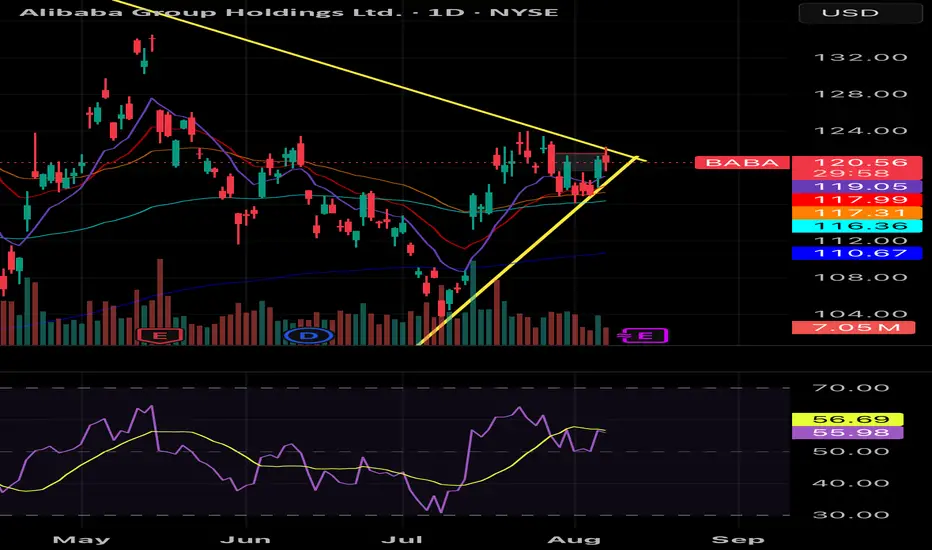
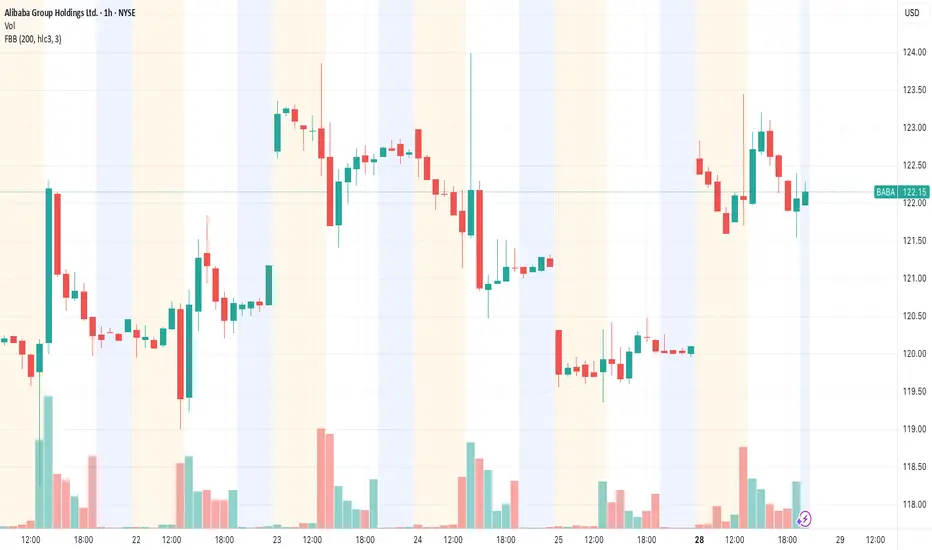
Alibaba Group Wave Analysis – 17 July 2025
- Alibaba Group rising inside impulse wave (3)
- Likely to reach resistance level 123.10
Alibaba Group recently rose with a sharp upward gap, breaking the resistance level 110.00 and the resistance trendline of the daily down channel from May.
The breakout of these resistance levels accelerated the active intermediate impulse wave (3).
Alibaba Group can be expected to rise to the next resistance level 123.10 (the former monthly high and top of wave B from June).