AAP trade ideas

Bear Flag Burned Me/ These Flags Love Bear MarketsAnd this one got me )o:
These puppies will bit you.
I had it in my brain that auto part stores will do well during a recession, and I think they may. Then ORLY missed earnings, and BOOM, this went down with it! I did not look at the other Auto Parts earnings dates, but I learned a lesson. It was sitting there is a bear flag, then broke up from the bear flag, so the inevitable usually happens. Bear flags love bear markets. The rectangle top should have also got my attention. I will be sure the sector is reporting close to each other or look at when the stock's siblings are reporting. You live and you learn.
I looked at it the day before it fell and said to myself, sell this Laura and I did not. Sometimes your gut is right. I was way up and sometimes it is time to let go. Now I will hold on at least until the next rally up and hoping there is one. Otherwise I will just lose I guess. But this sort of foolish mistake does make you want to kick yourself! And we all make them at one point or the other.
This is an example of my being stubborn and that does not always work out so good.
Don't you hate it when this happens? LOL I guess all you can do it blow it off and keep moving forward.
No recommendation.

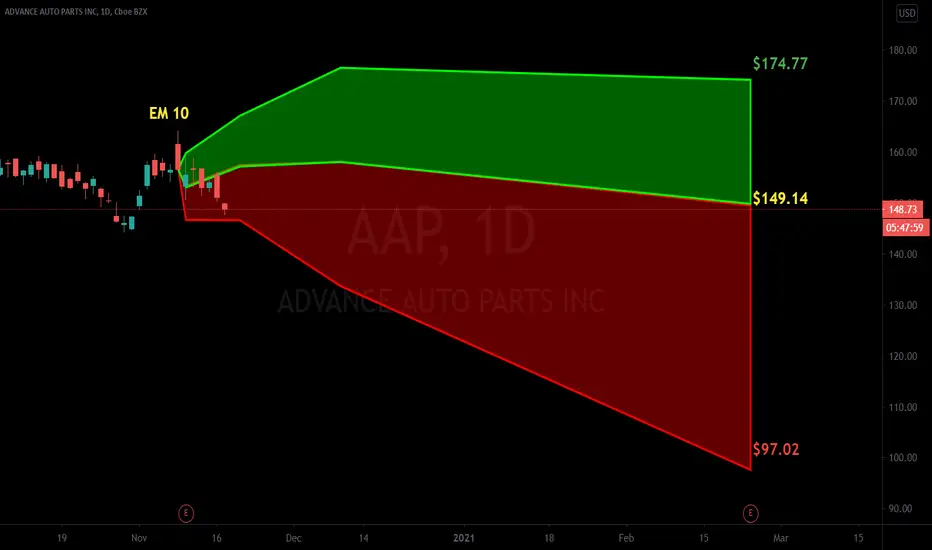
AAP Risky optionLooking at a 6.90 contract for Mar. 20, breakeven would be 226.90
Very risky but could be very good profits, if it touches my support again soon and holds, ill purchase. Fib seems stonr enough to support a $130 and that would be around 330$ profit. Plent for me!!
hehehehe
(PS I hate volume)

Earnings watch 2/14 post-marketEarnings watch 2/14 post-market:
AAP
CAR
INLB
POWW
ANET
CLR
AMKR
PHX
ASYS
OTTR
Do your own due diligence, your risk is 100% your responsibility. This is for educational and entertainment purposes only. You win some or you learn some. Consider being charitable with some of your profit to help humankind. Good luck and happy trading friends...
*3x lucky 7s of trading*
7pt Trading compass:
Price action, entry/exit
Volume average/direction
Trend, patterns, momentum
Newsworthy current events
Revenue
Earnings
Balance sheet
7 Common mistakes:
+5% portfolio trades, capital risk management
Beware of analyst's motives
Emotions & Opinions
FOMO : bad timing, the market is ruthless, be shrewd
Lack of planning & discipline
Forgetting restraint
Obdurate repetitive errors, no adaptation
7 Important tools:
Trading View app!, Brokerage UI
Accurate indicators & settings
Wide screen monitor/s
Trading log (pencil & graph paper)
Big, organized desk
Reading books, playing chess
Sorted watch-list
Checkout my indicators:
Fibonacci VIP - volume
Fibonacci MA7 - price
pi RSI - trend momentum
TTC - trend channel
AlertiT - notification
tickerTracker - MFI Oscillator
www.tradingview.com

Advance Auto Parts, Inc. NEUTRALAdvance Auto Parts, Inc. (Advance) is an American automotive aftermarket parts provider. Headquartered in Raleigh, North Carolina, it serves both professional installer and do-it-yourself (DIY) customers.

AAP new ATH setupVery nice uptrend in the daily chart, just retested some support and it is flagging nicely
Pivot price at $232
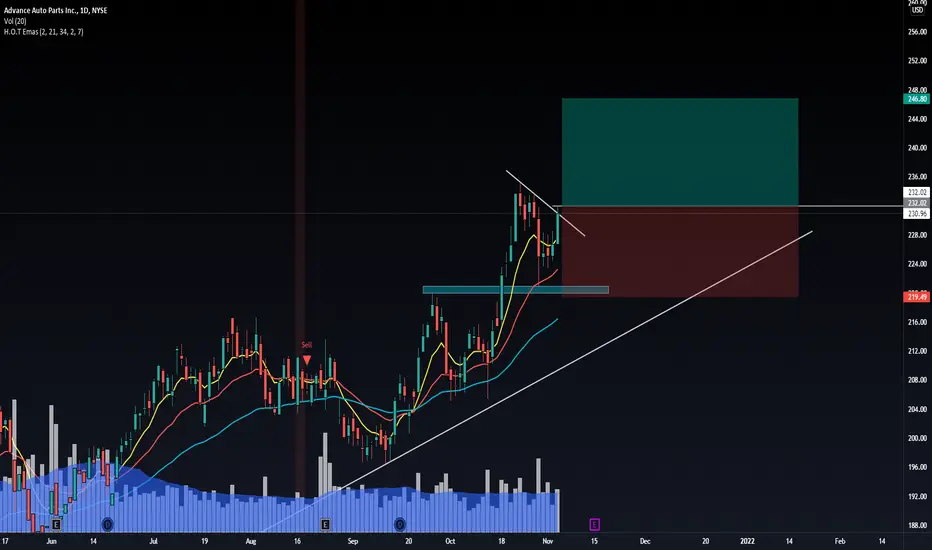
AAP has a few scenarios for upsideThere are 2 levels of support on this chart.
AAP has been in a nice uptrend since early in the year. Any pullback towards the green rectangle is buyable in my opinion.
Another scenario would be a break of the triangle instead of continuing to pullback

AAP breaking out but can it hold?* Making new all-time-highs
* Expected to better in the coming year
* Beta of over 1
* Not much volume following the break or even before the break
* Has been consolidating since 2015 and recently broke out again from $201.24
* Good long term hold as it pays out dividends
* This did break the recent all-time-highs of $210.18 but not with a lot of volume
* It broke the previous all-time-highs of $201.24 but couldn't hold
Final thoughts:
Look for buying opportunities around the $205.60
OR
Wait and see how the price reacts to breaking $210.18

AAP - Cup with Handle?AAP - a small cup with handle?
“Success isn't just about what you accomplish in your life; it's about what you inspire others to do.” One thing that is certain about success is it's rarely (if ever) accomplished alone!


Bull Flag Earnings 6-2Earnings today after market closes.
Bull flag is getting a bit long for the pole at this point and hoping the candle formation today does not take this one down for another test. There is a pocket pivot but it is well below price right now so the closest support is the bottom trendline of the flag. If price slows down there could be support at the bottom of that green candle that the red candle is trying to devour right now )o:
I would imagine if this beats today, it could bust the pattern and break the upper trendline of flag with conviction. Or they could beat earnings and still go down. Anyway, Zack says it is a buy if that means anything. They have earning misses in their history including a miss on EPS last quarter. Risky.
Dark cloud cover today which can be ominous but not always. Dark cloud cover (DCC) is a 2 candle pattern with the 1st candle being a good sized green candle. The close is at the top of the green candle body. The top of the wick is the high that day and is the same for both red and green candles as well as the bottom shadow being the low for that period. The green candle is followed by a red candle that opens (top of red candle is the open) higher than the previous green candle close but the bulls are unable to hold on and the close (bottom of red candle) is down in to the body of the green candle. It is worse if the red candle totally swallows or engulfs the green candle )o: Right this second, price is down to the open on yesterday. Earnings if received well, can change a candle pattern and candles often affect price short term or not at all. Some candles are stronger than others as well.
I suppose it is not unusual for folks to sell when earnings are due to avoid the market reaction. Today seems to be a struggle day for some, and a good day for others.
It is risky to buy at earnings. I have risked it before on certain securities, but try to avoid FOMO (fear or missing out) It is tough to make decisions like a buy at earnings and no one can make it but me. I can only look at what is in front of me and use the common sense God gave me, but I have trouble finding it sometimes. Common sense is not my strong point. LOL Neither is patience, but being patient can be a gift in the markets for sure (o:
No recommendation.
When opportunity presents itself, it is often too late to prepare.

AAP Short William Alligator : the stock is currently in a bullish position because the candlesticks are above the Teeth, Lips and Jaw and the lines are “eating with an open mouth” this indicates that the stock is in a strong uptrend.
RSI : the line is above 70, so the stock is overbought.
Candlestick patterns : there are three white soldiers which are a bullish confirmation.
Overall : it can be interesting to take a sell position on this stock because the stock is currently overbought. Entry price is lower than the current price for assurance and stop loss is set at -5%.

AAP 🌦So If I don't use indictors what do I use?
Answer: LDCs (lower degree corrections).
Whats that?
LDCs are essentially fractals that can be used as confirmation for buying and selling.
Intermarket analysis 👇

Long on AAP - Target 182- MACD Cross on the 4h chart
- Oversold
- colateral victim of r/wallstreetbets

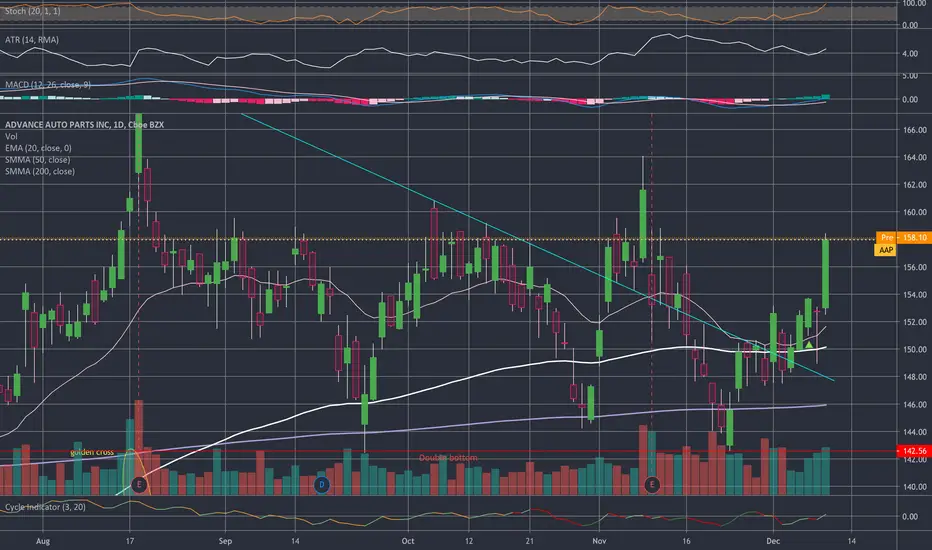
Next target 170Nice move today. AAP broke 160 resistance. But volumes are low.
I believe whe should see 170 by mid march.
This is not a financial advise.

AAP Breakout WatchWill enter if I see a breakout above the top line. Would prefer to see a bounce off support and enter there.

$AAP - i'd like to see a stronger break of the down trendThis is the "little stock that could"
Keeping my eye on a stronger break from the months of down trend

$AAP - still trying to break that DTwatching AAP closely. I am routing for it, but until it breaks the down trend, I cannot give it too much thought.

ADVANCE AUTO PARTS Course DailyHey people, ADVANCE AUTO PARTS is in a bullish momentum with a turning point and large volume of buying traded. The TIMEFRAME M1 we see a turn with a high volume of purchases issued, it goes to the top of its zone balance to make a test of it. Strong breakout potential the price then at the same time breakout the zone to join in another. Then go to the high point in TIMEFRAME H1 and go to the top that comes up (See TIMEFRME H4) With a return to the last top of TIMEFRAME D1. By taking advantage of the momentum we can breakout again not enough force to test the intermediate median of ANDREWS PICHTFORK.
Please LIKE & FOLLOW, thank you!

$AAP - trend reversalI am liking how this one is panning out. I have options and trusting the reversal has been rough but the last couple of days have shown why patience can be rewarded.
Hoping to sell this by 12/15. I do not want to gamble holding too much past 12/18 for impending pull back.

AAP: Descending Channel In a Strong Support ZoneDescending Channel In a Strong Support Zone
Thank you and Good Luck!

$AAP with a neutral outlook projected$AAP is projected to have a neutral outlook after a Negative over reaction following its earnings as per the PEAD projection with the latter placing it in Drift C
If you would like to see the Drift for another stock please message us. Also click on the Like Button if this was useful and follow us or join us.