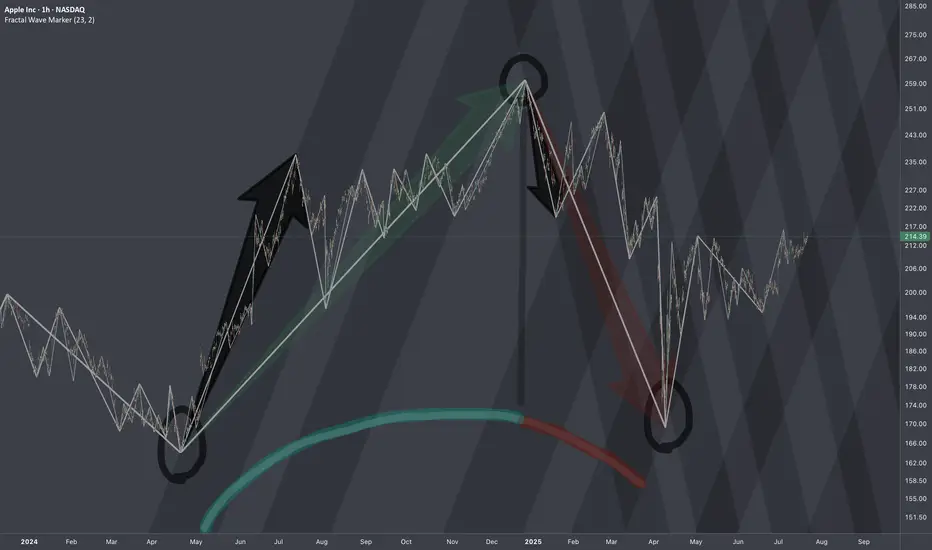
AAPL LIVE PRICE ACTION JULY 23 2025This is the price action for AAPL. I have discussed indicators as well. Do not blindly trade without understanding the logics. I am long here with stocks only.
NOTE: DO NOT BLINDLY BUY
Key facts today
Next report date
—
Report period
—
EPS estimate
—
Revenue estimate
—
131.85 MXN
1.85 T MXN
7.70 T MXN
14.92 B
About Apple Inc
Sector
Industry
CEO
Timothy Donald Cook
Website
Headquarters
Cupertino
Founded
1976
FIGI
BBG000KWV4C0
Apple, Inc engages in the design, manufacture, and sale of smartphones, personal computers, tablets, wearables and accessories, and other variety of related services. It operates through the following geographical segments: Americas, Europe, Greater China, Japan, and Rest of Asia Pacific. The Americas segment includes North and South America. The Europe segment consists of European countries, as well as India, the Middle East, and Africa. The Greater China segment comprises of China, Hong Kong, and Taiwan. The Rest of Asia Pacific segment includes Australia and Asian countries. Its products and services include iPhone, Mac, iPad, AirPods, Apple TV, Apple Watch, Beats products, Apple Care, iCloud, digital content stores, streaming, and licensing services. The company was founded by Steven Paul Jobs, Ronald Gerald Wayne, and Stephen G. Wozniak in 1976 and is headquartered in Cupertino, CA.
Related stocks

Time to buy? Too much negative press. Buy in Fear- Updated 18/7Apple has significantly underperformed compared to the other Magnificent 7 stocks, but I don’t believe it’s a company you should bet against in the current climate. With a slow rollout of AI and recent statements from Apple, they may not always be first to market, but they generally execute well. Th

Apple - The next major push higher!🍎Apple ( NASDAQ:AAPL ) will head for new highs:
🔎Analysis summary :
Apple has been underperforming markets for a couple of months lately. However technicals still remain very bullish, indicating an inherent and substantial move higher soon. All we need now is bullish confirmation and proper ri

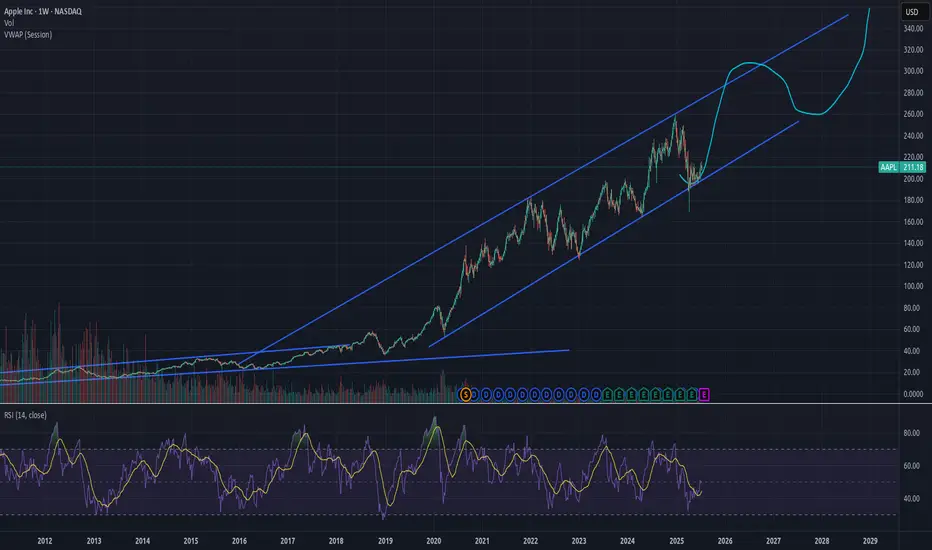
$AAPL: Structure SurgeryResearch Notes
Original Structure:
Altering structure for experimental purposes
Angle of fib channels that rises from cycle low, has been pushed into the past to the top of first major reaction. blue area resembles the change
Reason
The the angle of Fibonacci channels which cover th
Apple (AAPL) — Expected 20% GrowthThe fundamental outlook for Apple stock remains positive: the upcoming fall presentation and anticipated AI-related announcements are driving bullish sentiment.
Technical picture:
The price has broken through a key trendline, signaling a shift in momentum toward growth.
Near-term target: a move t

AAPL Weekly Breakout – Targeting $266Hello Traders,
Here’s my latest analysis on Apple (AAPL) based on the weekly chart.
🔍 Chart Breakdown:
Main Uptrend Channel (Blue): Price has respected this channel since 2023.
Red Downtrend Sub-Channel: Recent corrective phase is now broken.
Breakout Signal: Last week, AAPL closed above the
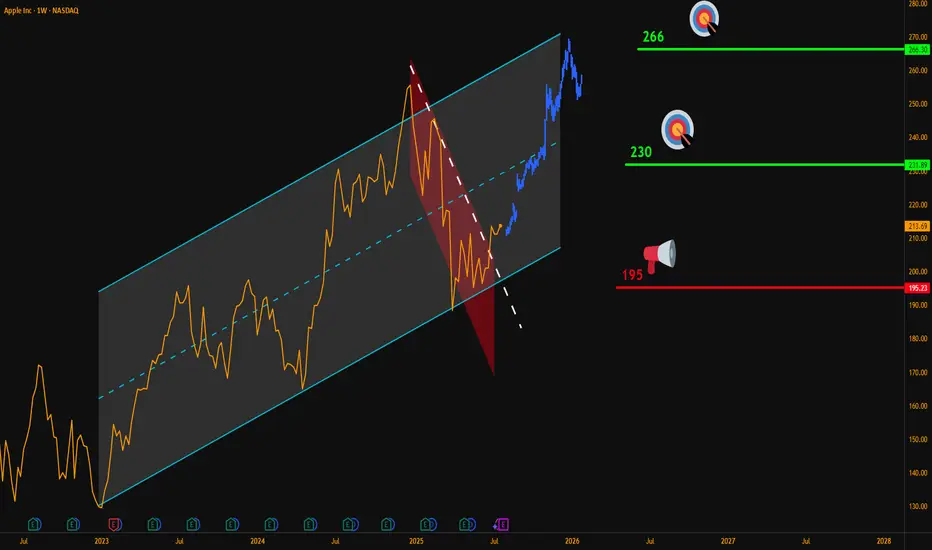
AAPL next leg up?A daily close above 213.75 could set AAPL to move towards 220
We are retesting some strong resistance at 215, and above it we could see price moving faster to retest trendline.
Keeping this on the watch as ERs is not far and we can see a pre run
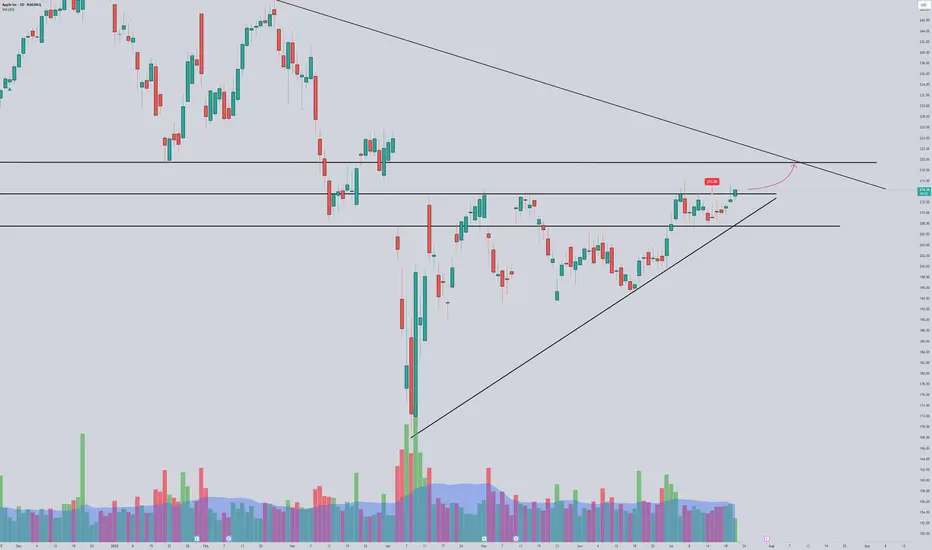
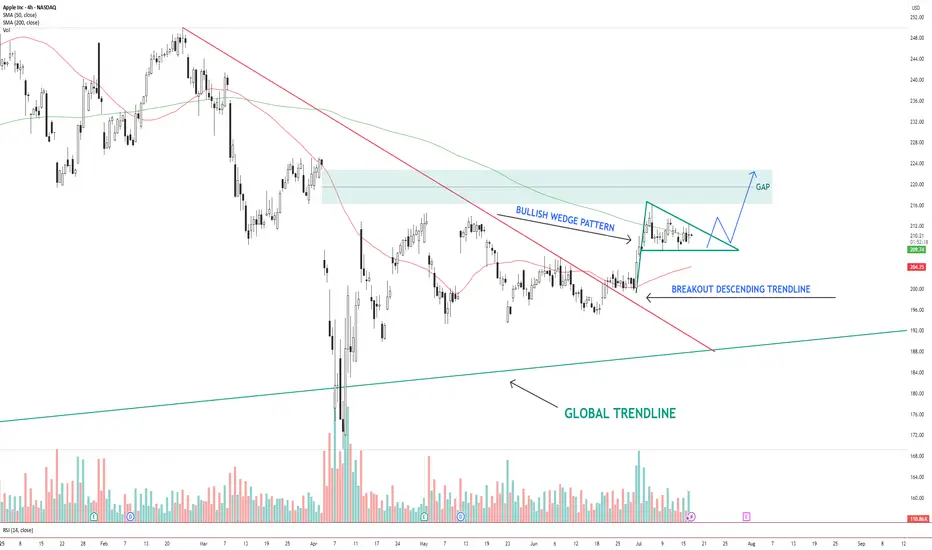
AAPL – Bullish Wedge Breakout Setup Toward Gap FillAAPL NASDAQ:AAPL has broken out of a descending trendline and is now consolidating inside a bullish wedge pattern . Price is holding above the 200 SMA and hovering near the 50 SMA.
The structure suggests a potential breakout above the wedge, with a clear gap area between $216–$224 acting
AAPL Set for a Breakout? | Technical Checklist & Projections
▍Observation & Context
▪ AAPL has been moving sideways within a clearly defined range for the past three months .
▪ On July 07 , price tested the range resistance decisively, showing some interest in the upside.
→ Let's first explore the bullish breakout scenario.
▍What Makes a Goo

See all ideas
Summarizing what the indicators are suggesting.
Neutral
SellBuy
Strong sellStrong buy
Strong sellSellNeutralBuyStrong buy
Neutral
SellBuy
Strong sellStrong buy
Strong sellSellNeutralBuyStrong buy
Neutral
SellBuy
Strong sellStrong buy
Strong sellSellNeutralBuyStrong buy
An aggregate view of professional's ratings.
Neutral
SellBuy
Strong sellStrong buy
Strong sellSellNeutralBuyStrong buy
Neutral
SellBuy
Strong sellStrong buy
Strong sellSellNeutralBuyStrong buy
Neutral
SellBuy
Strong sellStrong buy
Strong sellSellNeutralBuyStrong buy
Displays a symbol's price movements over previous years to identify recurring trends.
US37833DZ0
APPLE 20/50Yield to maturity
6.99%
Maturity date
Aug 20, 2050
US37833EF3
APPLE 21/51Yield to maturity
6.85%
Maturity date
Feb 8, 2051
US37833EG1
APPLE 21/61Yield to maturity
6.81%
Maturity date
Feb 8, 2061
US37833EL0
APPLE 21/61Yield to maturity
6.81%
Maturity date
Aug 5, 2061
US37833EK2
APPLE 21/51Yield to maturity
6.81%
Maturity date
Aug 5, 2051
US37833DW7
APPLE 20/50Yield to maturity
6.80%
Maturity date
May 11, 2050
US37833EA4
APPLE 20/60Yield to maturity
6.71%
Maturity date
Aug 20, 2060
US37833DQ0
APPLE 19/49Yield to maturity
6.55%
Maturity date
Sep 11, 2049
US37833EE6
APPLE 21/41Yield to maturity
6.26%
Maturity date
Feb 8, 2041
US37833DD9
APPLE 17/47Yield to maturity
6.10%
Maturity date
Sep 12, 2047
US37833BA7
APPLE 15/45Yield to maturity
6.07%
Maturity date
Feb 9, 2045
See all AAPL bonds
Curated watchlists where AAPL is featured.


Frequently Asked Questions
The current price of AAPL is 3,965.99 MXN — it has increased by 0.13% in the past 24 hours. Watch Apple Inc stock price performance more closely on the chart.
Depending on the exchange, the stock ticker may vary. For instance, on BMV exchange Apple Inc stocks are traded under the ticker AAPL.
AAPL stock has risen by 0.74% compared to the previous week, the month change is a 4.68% rise, over the last year Apple Inc has showed a −0.97% decrease.
We've gathered analysts' opinions on Apple Inc future price: according to them, AAPL price has a max estimate of 5,103.93 MXN and a min estimate of 2,579.81 MXN. Watch AAPL chart and read a more detailed Apple Inc stock forecast: see what analysts think of Apple Inc and suggest that you do with its stocks.
AAPL reached its all-time high on Dec 27, 2024 with the price of 5,249.00 MXN, and its all-time low was 0.09 MXN and was reached on Sep 9, 2010. View more price dynamics on AAPL chart.
See other stocks reaching their highest and lowest prices.
See other stocks reaching their highest and lowest prices.
AAPL stock is 0.83% volatile and has beta coefficient of 1.02. Track Apple Inc stock price on the chart and check out the list of the most volatile stocks — is Apple Inc there?
Today Apple Inc has the market capitalization of 59.29 T, it has decreased by −0.54% over the last week.
Yes, you can track Apple Inc financials in yearly and quarterly reports right on TradingView.
Apple Inc is going to release the next earnings report on Jul 31, 2025. Keep track of upcoming events with our Earnings Calendar.
AAPL earnings for the last quarter are 33.80 MXN per share, whereas the estimation was 33.34 MXN resulting in a 1.39% surprise. The estimated earnings for the next quarter are 26.74 MXN per share. See more details about Apple Inc earnings.
Apple Inc revenue for the last quarter amounts to 1.95 T MXN, despite the estimated figure of 1.94 T MXN. In the next quarter, revenue is expected to reach 1.67 T MXN.
AAPL net income for the last quarter is 507.67 B MXN, while the quarter before that showed 757.46 B MXN of net income which accounts for −32.98% change. Track more Apple Inc financial stats to get the full picture.
Yes, AAPL dividends are paid quarterly. The last dividend per share was 5.11 MXN. As of today, Dividend Yield (TTM)% is 0.47%. Tracking Apple Inc dividends might help you take more informed decisions.
Apple Inc dividend yield was 0.43% in 2024, and payout ratio reached 16.11%. The year before the numbers were 0.55% and 15.32% correspondingly. See high-dividend stocks and find more opportunities for your portfolio.
As of Jul 26, 2025, the company has 164 K employees. See our rating of the largest employees — is Apple Inc on this list?
EBITDA measures a company's operating performance, its growth signifies an improvement in the efficiency of a company. Apple Inc EBITDA is 2.84 T MXN, and current EBITDA margin is 34.44%. See more stats in Apple Inc financial statements.
Like other stocks, AAPL shares are traded on stock exchanges, e.g. Nasdaq, Nyse, Euronext, and the easiest way to buy them is through an online stock broker. To do this, you need to open an account and follow a broker's procedures, then start trading. You can trade Apple Inc stock right from TradingView charts — choose your broker and connect to your account.
Investing in stocks requires a comprehensive research: you should carefully study all the available data, e.g. company's financials, related news, and its technical analysis. So Apple Inc technincal analysis shows the buy rating today, and its 1 week rating is neutral. Since market conditions are prone to changes, it's worth looking a bit further into the future — according to the 1 month rating Apple Inc stock shows the buy signal. See more of Apple Inc technicals for a more comprehensive analysis.
If you're still not sure, try looking for inspiration in our curated watchlists.
If you're still not sure, try looking for inspiration in our curated watchlists.