ADAP trade ideas

ADP Buyback BoostADP buybacks are supporting the stock, and often driving price upward. The stock remains in a trading range long-term.


Weekly Long Idea10/Jan/2020 09:59 AM AUTHOR: Brandon Gum
--
I like the idea. 3% stop loss to below the recent daily range.
I think this could breakout. However if it fails I could also see some W shaped price action form.
I gotta study structure more to get better at understanding what could play out.
======================


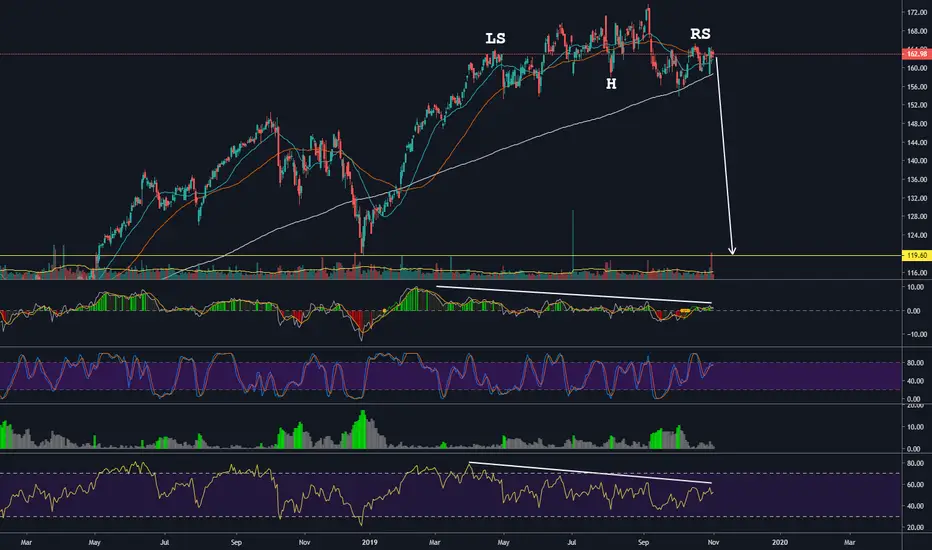
Short ADPBeautiful head and shoulders reversal set up, complimented with bearish RSI and MACD divergences. Break of the neckline around 153.86 should push the stock down to the target of 119.60.
$ADP continues in Bullish ChannelAverage price target $179.78 | Overweight
P/E ratio 31.33
Yield 2%
Company profile
Automatic Data Processing, Inc. engages in the provision of business outsourcing solutions specializes in cloud-based human capital management. It operates through the following business segments: Employer Services; and Professional Employer Organization Services; and Other. The Employer Services segment provides clients ranging from single-employee small businesses to large enterprises with tens of thousands of employees around the world, offering a range of human resources outsourcing and technology-based human capital management solutions, including strategic, cloud-based platforms. The Professional Employer Organization Services segment offers small and mid-sized businesses a human resources outsourcing solution through a co-employment mode. The Other segment comprises of non-recurring gains and losses; miscellaneous processing services; the elimination of intercompany transactions; and interest expense. The company was founded by Henry Taub in 1949 and is headquartered in Roseland, NJ.

ADP Platform Sideways PatternADP has shifted to a Platform sideways candlestick pattern, and is experiencing some Dark Pool Quiet Rotation™. However, there is underlying buying activity of Smaller Funds, Professional Traders, and Investors. The candlestick pattern is compressing on the upside of the Trading Range at this time.

Chart of the day: $ADP ABCD completionAnybody saw $ADP hitting its ABCD completion? Trump has overshadowed the fact that US Services PMI just came in 2pts below expectations and the major auto companies have been laying off workers as inventory piles up. ADP operating margins are at -1 standard deviation levels while its valuations metrics are at +1 standard deviation into a slowing economy. 1.6% forward real earning yield with a P/B of 13x (mean P/B @ 7x) when you can buy risk-free US 10-yr at 1.7% with capital appreciation potential? *cough* *cough*
No thank you very much.
P.S. Even Bill Ackman sold his oversized stake in $ADP.


ADP: CD leg commencing downside target $128, -12%Market is turning bearish again and ADP looks like it has completed a counter-trend rally to the 78.6% retracement level. ABCD downside projection of $128, -c.12% with stops placed within 3% of current price; 4:1 risk reward ratio.

ADP move upShortlisted with FINVIZ, all indicators show bullish momentum, we're looking into going long for ADP.
SSB: Ensure TP is before highest point within last 6 months.

ADP ShortOur Quant Algo has been flashing a short signal on ADP.
Expect the price to fall to atleast $123.
** This signal is the result of a quantitative analysis.

[ADP] Starting to phase 3?If the price bounces to $ 141.44, it'll continue in phase 2, but I think it's starting phase 3 because the RSI is down and the force of sale takes more than 2 years.

ADP: Expanding triangle formation I don't have a price target for ADP but it is interesting to see the resistance at $140 and the lower lows with a negatively diverging MACD. This is ultimately a bearish pattern.

Statistic from ADP:reason to be worried for buyers of the dollarToday's statistics on the US labor market may well disappoint. At least, this is indicated by data on the level of employment in the private sector from ADP. With an average forecast of experts in +190K, in fact the figure was +177K. Overall, there is nothing terrible in this figure. By itself, it is very, very good. The problem is that the States have become a hostage of excellent data. Markets have become too accustomed to numbers of + 200K and above. Accordingly, any negative deviation from the forecasts may be interpreted by participants of financial markets as the beginning of problems in the US economy, with all the ensuing consequences: a decrease in GDP growth rates, an end to the Fed's rate increase phase, and so on.
Just in case, let's remind you that today is published a whole block of data that includes not only the number of new jobs created outside agriculture, but also the rate of unemployment, and, which is no less important, in the conditions of the active phase of the FED interest rate increase - the average hourly earnings:
Pre-Forecast
15:30 USA 3 NFP (June) 223K 190K
15:30 USA 3 Average hourly earnings (m / m) (June) 0.3% 0.3%
15:30 USA 3 Unemployment rate (June) 3.8% 3.8%
As can be seen, the forecasts are rather optimistic and, in some cases, even aggressive, and therefore the chances that they will not come true fully or partially are high.
Thus, we see on the horizon a potential fundamental threat to the dollar.
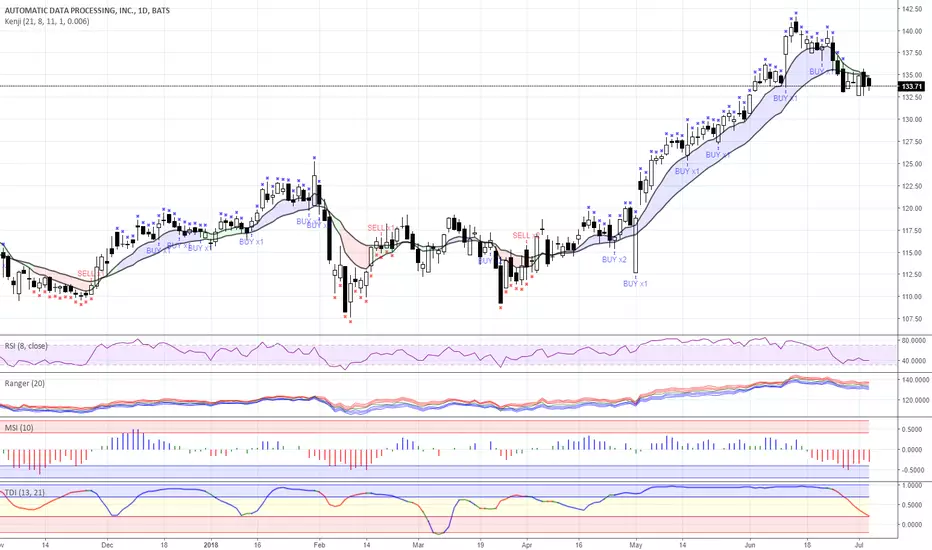
In addition, purely technically, if you look at the graph of the Dollar Index, you can see its inability to overcome the key resistance 95 and can see signs of a possible correction: consolidation at the top, the formation of reversal graphical patterns, candlestick signals, trend indicators enter into a neutral negative state (see KenJi and TDI indications), etc.
Total, dollar sales continue to look more promising than its purchases.

Long on Continuation setup!This presented as a low risk trade, Love these ebb and flow of trending price action

