AFRM trade ideas

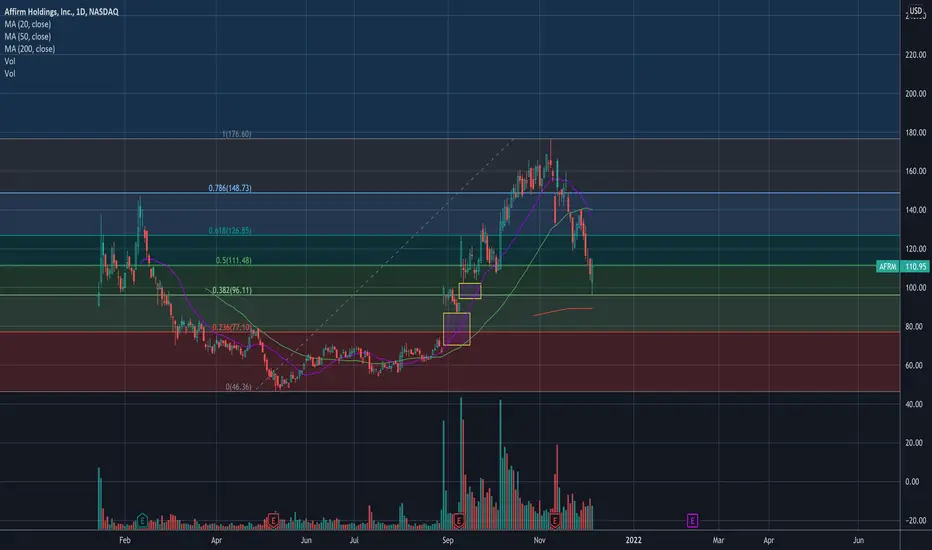
$AFRM - a likely case of gap fills?AFRM left behind 2 gaps. One at around $91 and the other around $69. It could close both of those gaps or at least close one.
We will see.
———————————————————
How to read my charts?
- Matching color trend lines shows the pattern. Sometimes a chart can have multiple patterns. Each pattern will have matching color trend lines.
- The yellow horizontal lines shows support and resistance areas.
- Fib lines also shows support and resistance areas.
- The dotted white lines shows price projection for breakout or breakdown target.
Disclaimer: Do your own DD. Not an investment advice.
$AFRM update s/d zonesWhat’s good traders!
-Buyers stepped in today.
-AFFRM currently sitting in demand and needs to get above the 20d moving avg.
-if strong buyers show up, we can eat through the supply zones above.
Thanks for stopping by!
-DP

AFRM Falling wedge setupWhats good traders!
Lets take a look at AFRM.
Christmas is around the corner and thousands of people are probably shopping online for expensive gifts. Some are probably using AFRM to purchase these gifts... Anyways,
- I see a falling wedge on the 30min timeframe.
-Price is back below the 20 moving average.
-We are currently sitting at the above the 30min and the weekly demand zones.
-If we dip into demand, we need strong buyers to show up along with strong volume confirmation for a reversal to the upside.
Let me know what you think in the comments!
Thank you for stopping by!
-DP

AFRM bearishIn the future, maybe have a Cup and handle pattern. But not now!
Price $132.20 (11.29.2021)
Target $100.89 (down 23%)
IMO

AFRMAffrim has massive potential if we can get above 139.5 lvl
This one should have some momentum behind it and algo shows that there is money flowed into this stock.
208 remains the target to the upside love this one as it holds 123.
s/t target is 153-163.

AFRM looking goodI am playing the same Fib retracement & EMA cloud setup on all my picks this week. Trying out a new strategy.
AFRM retraced to the .618 and reacted beautifully. Double bottom at the .618 plus the wick on Friday's candle shows it is a valid level of support. This area has been prior resistance turned to support so that gives me additional reason to believe we will get a bounce. Blue EMA cloud is also acting as support at that level. If the .618 is breached and a candle on the 1HR closes below it I will exit the trade. Looking to ride this back to $150 be the end of the week.

$AFRM SUPPLY AND DEMAND ZONESWhat’s up everyone!
Let’s take a look at $AFRM.
-11/10/21 AFRM reported bad earnings and price dropped down the 4hr demand and bounced up.
-Price is currently trading below the 20 day moving average which is bearish.
- I see a head and shoulders pattern forming on the 4hr timeframe.
-If we break below the 4hr demand zone, $131.68 we can target the next demand zone below which is $123.38.
Let me know what your thoughts are in the comments!
Thank you for stopping by!
DP

Affirm developing a 4thAfter what I think was an extended iii wave seems that price is correcting that could take us to the 23.80% Fib or 38.2% Fib retracement where we could see a bounce back to the upside looking for a v . If that happens we would have a 1 followed by a 2 that could retreat 61.8% Fib of 1 . If entering a trade at the end of iv I would set the take profit at the 38.2% Fib Ext. or 61.8 Fib Ext. , I would not risk to go beyond as the 2 wave will come sooner than later and tends to be a big retracement in price.

$AFRM Consolidating at a tough range.$AFRM consolidating on range between $144 to $149 tried to break but failed. falling EMA clouds are curving now it is crucial moment to hold this level and retest to break $150 level to create a reversal upside trend. if failed to hold this level will see down Fall $134.

AFRM update Daily timeframeupdated count with possible invaildation in minor 3 over 423.6% of minor 1.

Affirm ShortAMAZON deal has been clouded for a terrible earnings. Inflations rising, this news would’ve been great when everyone was receiving hand outs. We should see a 133 drop, if there’s support then it’ll bounce if not then sub 100s. Amazon news just making this bleed out slowly.

Affirm IPO buyers had made double, what about you ?Fret not, if you have not participated in the IPO shares of AFRM, here's your chance again though the price may be higher.......
Note there is a gap up yesterday after it released its good results,read article here


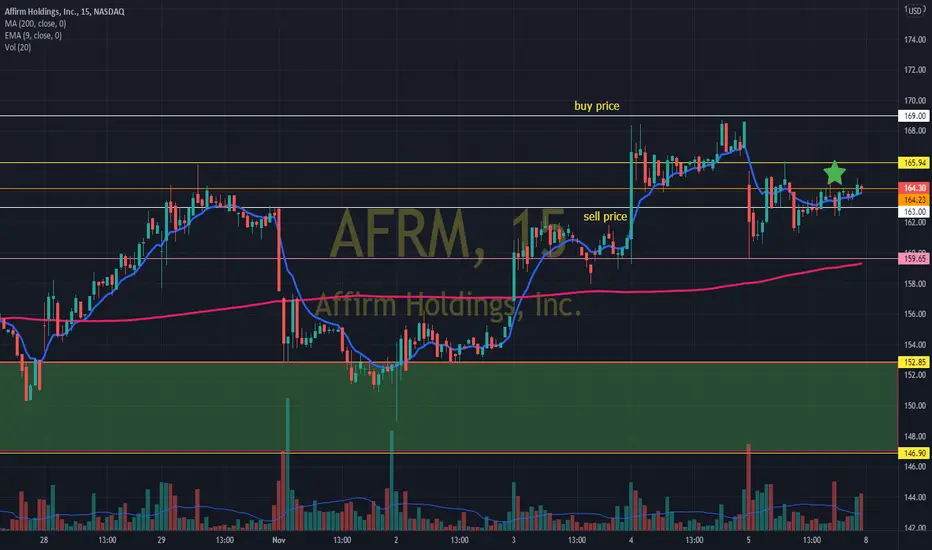
strategy AFRM for monday 11/08/2021AFRM: buy price (169.00)
AFRM: sell price (163.00)
strategy: we will confirm our bullish entry above the buy price, we must wait for confirmation, one important thing is that afrm is making its 52wk high, it also has an inside bar on the daily chart.
our bearish entry: it would be a much better bearish gap and go, if it manages to break the previous day's low of 159.65. possible profit taking in demand zone 152.85.00 and 146.90.
Note: always remember to mark the support and resistance in the pre market hour
AFRM SHORTThis will be an unpopular opinion but this ascending wedge in declining volume coming up into earnings is concerning. Anchored VWAP from the gap up and the 50 day moving average around 130 should support it for a nice re-entry point

AFRM - Finally broke the consolidationAFRM - Broke the 2 weeks consolidation.
Wait for the follow through confirmation ,It will pick up the steam coming weeks if the price sustains at this level tomorrow.

AFRM Updated verison daily frameupdated count
its foolish to short this chart, waiting for some confirmation would be the only reasonable decision.
looking for resistance near 180

AFRM Head and shoulders shortthis was not posted on time but here is another head and shoulders banger that hit on AFRM Charts

All Time High created for AFRMAffirm has been trading in a strong uptrend and recently touched its all time high and has been trading at higher levels. It has potential to touch 200-220 with in a few days in this rally before any significant profit booking happens.
Disclaimer:
For educational purpose only. All disclaimers apply.

AFRM: Consolation & BreakoutVolume is falling. I think folks wanna see what will come of earnings & that will be the catalyst in the breakout - for whichever direction. Up or down. From here some consolidation is in order.
Good luck to everyone!

$AFRM - potential 75% upside with C&H breakouthandle is currently being formed.. so potential upside 75% with breakout from that massive cup & handle pattern.

Uptrend ChannelWe are in this channel since Oct 6, a doji candle was form in the 4H chart so we can experience a minimal pullback in the following days to the support line. Overall we are in a uptrend and we also broke last ATH at 146. I'm looking to add long positions at 150-151 or after breakout of the resistance line in this channel.
The horizontal lines are standard deviation. The yellow line is the mean and is acting as support right now. I'm not a financial advisor and this is my personal opinion. Have a great trading week! NASDAQ:AFRM
