AMC Moment of truthAMC that is the point where it should be bounce back higher. AMC must hold 20$ otherwise we will dip down to 15.
AMC trade ideas

Probably not what you want to seeLet me explain how markets work, it’s a game of back and forth searching for points to retest of broken support/resistance. Currently amc has been on the hunt for broken resistances from the past that never got retested. The broken supports that we have been getting already have been retested and sold off immediately. Emas are in bearish posture, I’d be careful with this one full retrace is possible.

$AMC: Squeeze Update!⚡15$ Support confirmed by VPVR node + golden pocket retracement + 200 week sma + 2 trendlines of support (Previous resistance)
⚡MFI breakout could lead to a massive rally
⚡18-20$ resistance confirmed by VPVR node + resistance trendline + 0.5 Fib
⚡23.5$ Ichimoku Cloud resistance
⚡0.236 Fib resistance needs to be broken for bullish price action
⚡Worst case scenario should be 9.45$ (Huge VPVR node) + 7.86 Fib support
⚡Break 34.46$ double bottom (previous support) strong resistance. Once this level is broken a squeeze could occur.
⚡If AMC breaks the 200 week sma i wouldn't expect any significant price action for months
⚡Watch for a spike in volume at these levels
⚡AMC is ready for new ATH once the weekly Ichimoku Cloud resistance is broken (40$)
⚡Options looking bullish, lower price targets are less likely
*WARNING* This thread is not financial advice. I am not a financial advisor.

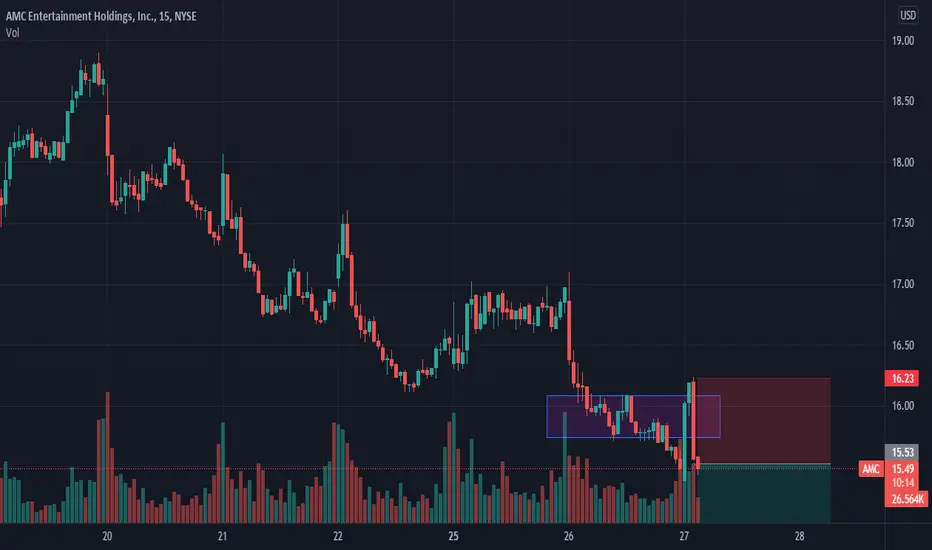
AMC Prediction Blue Line Predication- if it comes down to retest at $15.22 then it could just tap in for the 4th tap in order to push up for a retest at $15.65. The gray box is where it will tell me whether the market will bounce back up for a rest or continue going down for TP $14.75
Gold Line Predication- if it closes below the gray box or the blue line then it will continue dropping to $14.75 and could retest at $15.28 because that's where BOS happen

AMC -Bullish!Analysis...
The impulse from the low of $1.90 to a high of $20.30(27Jan 21) was the beginning of the yellow intermediate degree wave 1. The correction of that degree brought the price of AMC stock to $5.23 which completed wave 2 in the yellow intermediate degree in-turn beginning wave 3 in yellow which should unfold in 5 wave in the red minor degree(one degree lower than yellow). That 5 wave move began from $5.23 to a high of $72.38 completing wave 1 in red, since then we have seen price in a gradual decline for those highs of $72.38 to $12.72, The decline has unfolded in a 7 swing sequence(WXY in the next lower green degree) completing wave 2 in red. We now take the impulse from $12.72 to $34.22, which broke the above channel trendline as an impulse in the next smaller degree purple. If we then stay above $12.72 then we should see new high in AMC and the Bullish cycle will be confirmed.
Alternate view!
If however we break below $12.72 the we should be expecting a 11 swing sequence which should take the price one more low to the lower end of the channel BUT that move should at least terminate above $5.23 as it will change the whole outlook of the structure if it goes below.
Targets!
When looking at the red degree price extensions we should expect price to easily reach: First -100% extension of $178 then second 161.8% extension at $906; these are very plausible targets as long as we stay above $12.72.

AMC - The Next Moonshot? I stalk it.Beginning from the left, we see where price broke out, where many made and lost millions. From there on, price went down with huge up-swings in between.
What's that orange inside pitchfork?
This pitchfork gives us a kind of a Swing-Frequency.
What does this mean?
Well, it's nothing more then a measurement of this stocks swing volatility. Furthermore it combines time, by measure and projecting the slope.
As we see, the slope is slightly pointing upwards.
In short, these lines show where we have highly potential support & resistance..
And there is the yellow Channel, the boundary where price trades within.
The Stochastic shows, where we have a hint for a potential move to the upside. We can combine this with the overall analysis and with price action.
Lastly we have the red pressure-cooker line on the most right part of the chart. This pressure line indicates that price is really squeezed down, waiting for a pop through it.
To me, a potential trade could be a breakout through the pressure-cooker line. The problem here is, that for now, nothing indicates that it will happen soon. Even the indicator is not fully oversold yet, so it could break above it's signal line.
I'm waiting for a clear signal.
Just something, that makes me scratching my head or catches my eyes attention.
Observation Hat ON.
#amcquickie

Great spot to play both ways slightly OTMI don’t usually use linear regression channels because this is supposed to be a stochastic process.. but they actually work well for near term moves especially when the price is sitting directly on center line - good chance it will visit one of the borders soon and if range is wide enough playing both sides simultaneously with OTM cheap enough that you can make good return if either border is hit.
For AMC notice that the last touch of lower border was followed by small bounce to center and then back down. Since it could very easily follow that pattern in reverse (drop to center from touch from upper border followed by bounce to just under upper border) in a squeeze potential environment such as this I like 3:2 calls to puts. Not financial advice.

analysis-uptrendOn AMC we have a breakout with force the vwap indicator by a big candle with a large volume so we have a big probability of an uptrend as you see on the chart.thanks.


analysis AMC, sellOn AMC we have a downtrend so we have a breakout of the support line by force with a large volume.
Falling WedgeSometimes it doesn't take a genius. We're in a falling wedge reversal pattern. I learned how to Dot to Dot in grade school. Might not be exciting for a while or maybe it will...Might drop to $12 if it stays in the wedge or even lower for a minute if it does a fake out break down before the rip. (which it has been doing lately) The SPY isn't helping but the clock is still ticking Captain. Maybe save some buying power for that. Before June 2nd or 3rd or maybe after. Patience Comrades... NFA.

AMC TECHINICAL ANALYSIS PREDICTIONNYSE:AMC
clear distribution playing out. Question is if it can hold the monthly key level (red) l. If not, watch out it may go all the way down to 12.90. Need to break green down trend for a sign of accumulation. But also, if it breaks back into the daily and 4hr, it can be a sign of reversal but it needs to hold that 4 hr level.
Shout out CottonCandyTA, I'm in love with this type of technical analysis.

Smooth Brain AnalysisWell I was just messing with regression trends then I saw this reflection line or what ever you want to call it not sure what it is but it is interesting to me. If anyone can make sense of it let me know!

Analysis AMC uptrendGood morning all. Today on AMC we have a big probability of an uptrend because we have:
- Breakout of the resistance line by a big candle with a large volume;
-Breakout of the vwap indicator by a big candle with a large volume.
- Breakout the vwap indicator.

$AMC: Squeeze On Earnings?⭐Bullish Descending Pattern for over 9 months (Target of this pattern is 72$)
⭐Bottom trendline support bounced the price 4 times with significant volume (Previous1400% gain, strong level of resistance)
⭐Strong bottoming signals on the MFI (Last time this happened a 1400% move occurred
⭐14.8$ Support confirmed by VPVR node + 7.86 Fib + Trendline + Volume
⭐A break above 20$ (Ichimoku Cloud + multimonth consolidation zone resistance + large VPVR node) should lead to a large spike in the price of AMC
⭐24$ Ichimoku Cloud resistance needs to be broken
⭐0.5 Fib (31.8$) Resistance, once this level becomes support the options chain should push the price to higher levels
⭐If a daily candle is closed below the Ichimoku Cloud with a significant amount of selling Volume the squeeze will be delayed (We need daily closes above 16$)
⭐I am of the belief that this is the bottom due to the trendline support + the bullish divergence on the MFI
⭐By looking at the Options Chain a move below 16$ is highley unlikely
*WARNING* This thread is not financial advice. I am not a financial advisor.

strategy for AMC monday 04/25/2022Hello trader, we are going to work with the maximum and minimum of the previous day of the daily chart. this form will give them more confidence when operating. One of the things that we must have pending is the trend of the previous day, this is very important for entering the market.
for example: AMC. It leaves a downtrend, for this reason my bullish entry is above (16.64) until I look for the high of the previous day if they continue.
The opposite is the case if the stock starts with an uptrend, but it closes the day with a slight correction. here the operation would be the opposite with an opening above the closing price we must let the price rise without taking a bullish entry, this is because the price has just entered the sell zone it is best to wait for it to reach the maximum and in that point wait for confirmation to sell
AMC: bearish entry will be below (16.00) next support zone (14.88) when the stock closes very close to the previous day's low it is called bearish continuation intention. Perhaps this post does not have much view, because many traders prefer to lose and then educate themselves


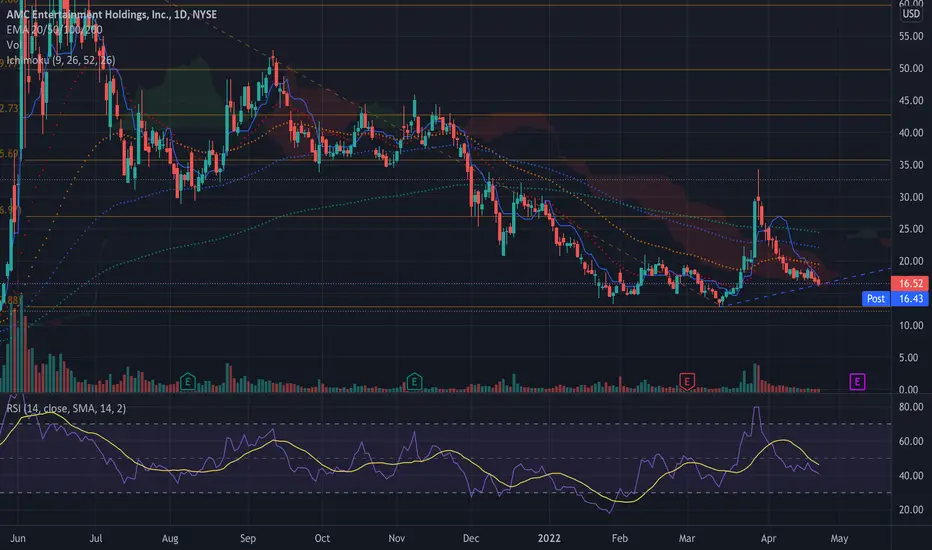
Where to watch for a bounce as AMC goes lower.In its downtrend, AMC printed the most recent lower high at the $18.92 level on April 19 and the most recent confirmed lower low was formed on April 13 at $16.94. On Friday, AMC was trading down toward what will eventually be the next lower low in the pattern and bullish traders looking to enter for a bounce back up can watch for a reversal candlestick to eventually form.
If AMC closes the trading day near its low-of-day price, it will print a shooting star candlestick, which could indicate lower prices will come again on Monday. If the stock is able to find buyers and close the trading day flat or near the high-of-day, the stock will print a doji candlestick or hammer candlestick, respectively, which could indicate a bounce to the upside is on the horizon.
The bounce is likely to come soon because AMC’s relative strength index (RSI) is measuring in at about the 40% level. When a stock’s RSI nears or reaches the 30% level it becomes oversold, which can be a buy signal for technical traders.
The move lower on Friday was on lower-than-average volume, which indicates the stock may be running out of sellers, which also points toward an imminent bounce. At press time, only about 19 million shares of AMC had exchanged hands compared to the 10-day average of 34.34 million.
AMC has resistance above at $17.07 and $20.36 and support below at $14.96 and $12.22.
Summary on AMC reversal trend (downtrend)On AMC as we see on the chart the sellers have reppelled the buyers with this big candle which broke with force the vwap indicator in addition we have a large volume so the market has gone down.thanks.

Analysis AMC uptrendOn AMC we have a situation of bearish channel. Here the resistance line is very important than the support line. As you see on the chart we have a breakout of the resistance line by a big candle with a large volume so we will have a big probability of an uptrend

AMC Major Upwards Movement SoonA lot of AMC apes are worried about the day-to-day price movement. In my opinion, as long as it doesn't drop below 14.50 for more than a day, I'm hyper-bullish on a run up between now and the start of August.
Keeping calm and accepting that this could take a couple more months before it blows will do wonders to investors' mental health. Stop worrying about little drops. The stock is still within it's descending triangle. Soon, but not that soon we will break out.
Be smart. Be patient.

New Range, Who Dis?AMC's recent move to $34 established the upper limits of new trading channel. Once the market picks back up AMC will head to $40. A breakthrough of this new channel could bring $50-60 range and create the opportunity for new all time highs.

AMC at a great buy price, but keep it small.update to last post - buying swing calls on this pullback with price around 17.80. Price may move down to 17.40-17.00, based on 30min chart, so I am keeping it a small position to hold. Will exit fully below 17 or if I do not see RSI and stochastic becoming more positive.
