AME potential Buy setupReasons for bullish bias:
- Price at a strong support level
- Price retraced from 0.786 fib level and it broke the 0.5 resistance level as well
- Strong bullish weekly closing at a rising trendline
- Bullish divergence
Here are the recommended trading levels:
Entry Level(CMP): 163.28
Stop Loss Level: 135.60
Take Profit Level 1: 185.24
Take Profit Level 2: Open
Note: An SL at 145.58 can also be placed as it's a strong support zone but the trend structure will only break if 135.60 breaks, partial profit at 175.88 can also be taken.
AME trade ideas

AME Nice time to short.Level break.
Short on 164,50
SL 165,35
TP 159 (33%) , 152 (33%),136 ( 33%)
P/L > 1/5
Not financial recomendation/
Do on your own risk.

AME - Idea3 hours ago
Idea for AME showing a sharp rise due to an angled structure
This large rise is the right arm of the structure

AME Ametek Is Approaching An Excellent Short Zone. To Ensure Proper R/R, The Bulk Of My Short Orders Are Weighted Near The Top Of The Zone. I Like To Refer To This As A "Bullet Catch" Pattern. From Oct-March, Price Slowly And Deliberately Rejected The ATH. This Is A Weaker Move To Fill Shorts.

AME Long IdeaAME looks poised to breakout as it consolidates in a tight range near the highs. Entry could be taken on a breakout above the 148 level or one could wait for a pull back into the box. Short term stop would be below the box. A longer term stop would be below the 618 RT. Pays a small dividend and is in the strong industrial sector. Down side would be that it may not move fast.

$AME with a Bullish outlook following its earnings #Stocks The PEAD projected a Bullish outlook for $AME after a Positive over reaction following its earnings release placing the stock in drift B with an expected accuracy of 55.56%.

$AME with a Neutral outlook following its earnings #Stocks The PEAD projected a Neutral outlook for $AME after a Negative over reaction following its earnings release placing the stock in drift C with an expected accuracy of 75%.

AMETEK | Sell Opportunity for BearsIf you find this technical analysis useful, please like & share our ideas with the community.
What do you think is more likely to happen? Please share your thoughts in comment section. And also give a thumbs up if you find this idea helpful. Any feedback & suggestions would help in further improving the analysis.
Good Luck!
Disclaimer!
This post does not provide financial advice. It is for educational purposes only! You can use the information from the post to make your own trading plan for the market. But you must do your own research and use it as the priority. Trading is risky, and it is not suitable for everyone. Only you can be responsible for your trading.

AMTEK | Sell Opportunity for BearsIf you find this technical analysis useful, please like & share our ideas with the community. Coming to the technical analysis of AMTEK , I think we are going to strong bearish movement. If you are going to go short, make sure to place the stop above the previous rejection area .
What do you think is more likely to happen? Please share your thoughts in comment section. And also give a thumbs up if you find this idea helpful. Any feedback & suggestions would help in further improving the analysis.
Good Luck!
Disclaimer!
This post does not provide financial advice. It is for educational purposes only! You can use the information from the post to make your own trading plan for the market. But you must do your own research and use it as the priority. Trading is risky, and it is not suitable for everyone. Only you can be responsible for your trading.


the b[AI]te's weekly insights -- AME 2021-01-25center stage image
stock
our system found that NYSE:AME received the best image over the course of last week.
comment image
we see a moderate negative correlation with our image indicator. We therefore assume that prices are driven partial emotionally and that there is probably some other catalyst with regard to the company resulting in an uncertain pricing.
new free tool
we launched our new free analysis tool. Check our website and test it out!
FAQ
ATTENTION
our algorithms define ATTENTION as the overall number of stories and opinions that appear for a given security each day
IMAGE
our algorithms define IMAGE as the averaged sentiment value extracted from all opinions received for a given security per day.

Short AMECan't see it on the Tradingview data but this morning NYSE:AME spiked out on the morning open for a short opportunity. The pattern also happens to match with an Ichimoku cloud pullback.

daily analyses of AMETEK INC Hi friends
the daily chart of this market shows with a high probability an uptrend in the coming days
please subscribe to receive more analysis
thank you...


BIG Potential to AMETEKHey traders, AMETEK is in a bullish gap that it seeks to fill, an attempt to fake breakout of the equilibrium zone from above. It is located on a bullish trend support which it will break from below to go to the last previous one below. A price agreement is to be sought after execution, great potential to go above the first candle in the gap.
Please LIKE & FOLLOW, thank you!


AME: Part 2: Heading north and nothing is stopping thisThis is amazing and ready to take off. Reporting end of July. Will add:
Aug 16th: 90c
or
Sept 20th: 95c

AME: Making a beautiful inverse h&s---Part 1I am studying more about this company and will post another chart with more details (esp fib). Looking good

$AME Inverse head and shoulders as well as Bullish PennantInverse head and shoulders as well as Bullish Pennant

AME - Further uptrend after breaking the bull flag Stock recently bounced off a support level and is breaking out of a bull flag. Expecting further upside from here.

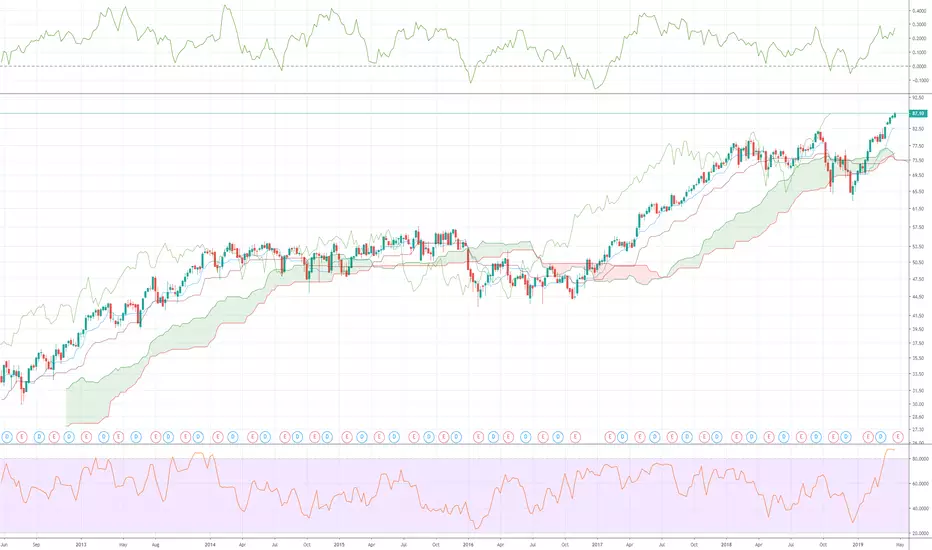

AMETEK, Inc.DAILY
all time high at 81.92
uptrend
inverse H&S
tendency is upward
initial support at 75.92 to 75.01
