A.O. Smith Corporation (AOS) – Symmetrical Triangle Breakdown🔎 Description:
AOS has formed a symmetrical triangle pattern and has broken downward, signaling a potential bearish move. Given the prior downtrend, this continuation pattern aligns with the overall bearish momentum.
📉 Trade Setup:
Bias: Bearish
Reasoning: Breakdown of symmetrical triangle in a downtrend
Confirmation: Price closing below the pattern with increasing volume
Trade Type: Short
🔑 Key Levels:
Entry: Near 65.61
Stop Loss: 🔴 69.34
Target: 🟢 63.09
📊 Watching for further momentum to confirm downside move. 🚨 Manage risk accordingly!
AOS trade ideas


AOS Triple bullish divergence 1D including support rejectionStrong Triple bullish divergence, pinch down rejected, bar closing above previous bar close
Impuls on weekly blue
E. 68,68
TP 71,26
SL 67,04
Trade #00008
6 trades close, 4 out of 6 worked: hitrate: 66,7%

$AOS with a bullish outlook following its earnings #StocksThe PEAD projected a bullish outlook for NYSE:AOS after a positive over reaction following its earnings release placing the stock in drift B with an expected accuracy of 50%.

Bullish Alert for AOSNot yet confirmed but there is a nice consolidation area while EMAs are trying a crossover.

AOS SMITH (A.O.) CORPThere has been a breakout followed by a local correction. This pattern indicates the possibility of a strong trend emerging.
TP1 77 TP2 82
SL 68

AOS - Above Middle ChannelPrice is currently sitting above the middle of a large up channel. This is preceded by a large inverted H&S pattern. I expect the middle to act as support and price to move upward as indicated by the bars pattern.

ICT Approach To Stocks. AOS Ticker ✨Hey Guys, Yurii Domaranskyi here. Risk vs Reward = 1 to 9.8 ✨ It means if you risk here 100$ you may make 980$ Not bad, huh?


AOS CURVE LINEA. O. Smith Corporation looks bearish and under the curve
the stop loss is the blue line
timeframe is 4h

Breakdown!Watch out below. Something has happened. Lava-flow price-action. Busted through trend-line & 200 sma support.

AOS forming an inverse head and shoulders.AOS has been forming an inverse head and shoulders since May of 2021 and now looks like it's ready to move higher.
Fundamentally, the company's doing pretty well and is expected to do better in the coming year with increasing earnings per share and sales.
Technically, it has been on a solid up trend and now is looking to continue. With a Beta over one it's expected to continue in the direction of the general market.
Trade idea:
* Look for buying opportunities after a daily close above $73.05 to further confirm the inverse HS break out.
Target:
* The target for this pattern break would be around the $80.50 area.

$AOS Basing around its 50 MA (H&S Continuation Pattern)$AOS inverse head & shoulders continuation pattern right underneath ATHs. The green dotted line on the chart is the ATHs from back in 2018. #TAPLOTWL
Smith A O Corp (AOS)- MANUFACTURES WATER HEATING EQUIPMENT FOR VARIOUS RESIDENTIAL AND COMMERCIAL MARKETS WORLDWIDE.
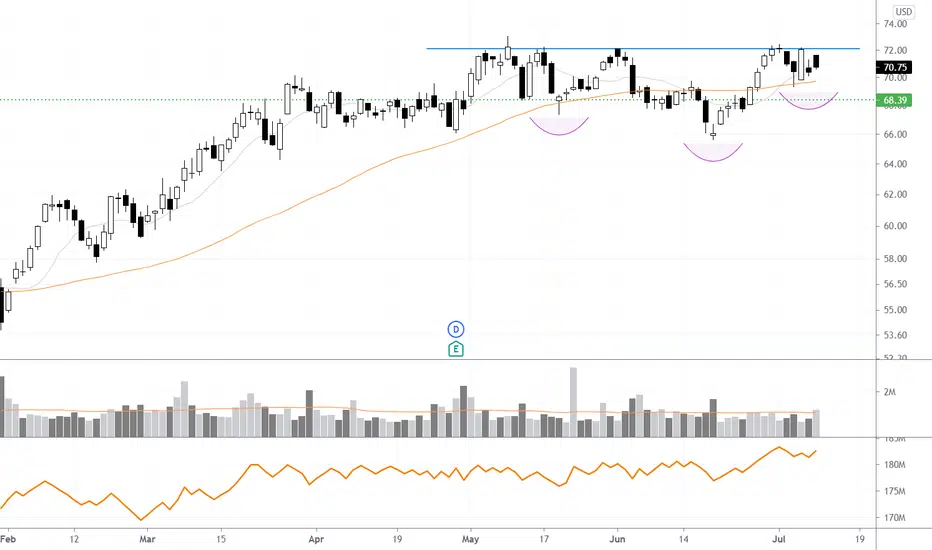

AOS more upside to come?This stock has been in a steady uptrend since Feb 2021. It is also attempting to break all time high $73.05 on 10 May. Uptrend still intact, support at $68.50 or $66.

AOS. In consolidation mode.AOS is at AH and has formed round base on weekly and now consolidating in symmetrical triangle, that means both possible directions which price could move.
One should notice that the price forming a handle and it also can decline more.
Not a recommendation, just an observation.


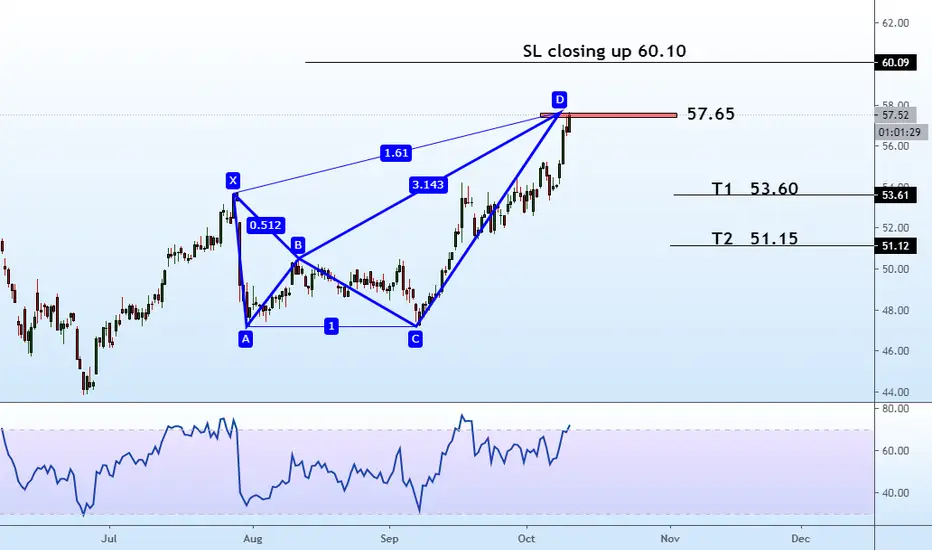
AOS 4h chartAfter achieving the first and second targets, prices returned to the selling area again and began to decline, so I advise selling again for the targets
T1 53.60
T2 51.43
SL closing up 60.10


Bullish flag.Picked up this stock by Smarttrader on youtube. See if it continues on the flag and will consider buying an option on this one. Read a bit on the company and it seems interesting with people spending more time at home.


BUY to SMITH A O CORPHey people, SMITH A O CORP is in a bearish fake dynamic with bearish continuation and more buying and selling volume. In TIMEFRAME 5 1Min we see a bull line, which means that there is no decision. But the tendency remains buying, it will break its VWAP with force and break through the stabilization zone. Strong potential to join the last previous high but there is a bullish gap to fill. We can arrive on the bottom of the fence of this one, which is a strong support See the TIMEFRAME 4H.
Please LIKE & FOLLOW, thank you!
