Arm Holdings plc Quote | Chart & Forecast SummaryKey Indicators On Trade Set Up In General
1. Push Set Up
2. Range Set Up
3. Break & Retest Set Up
Notes On Session
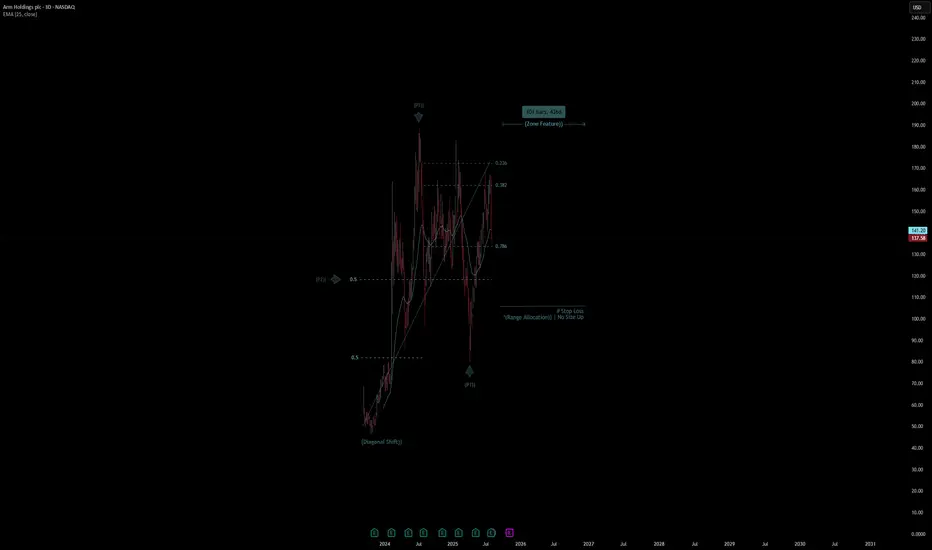
# Arm Holdings plc Quote
- Double Formation
* (Diagonal Shift)) At 50.00 USD| Subdivision 1
* (Zone Feature)) | Completed Survey
* 118 bars, 509d | Date Range Method - *(Downtrend Argument))
- Triple Formation
* (P1)) / (P2)) & (P3)) | Subdivision 2
* 3D Time Frame | Trend Settings Condition | Subdivision 3
- (Hypothesis On Entry Bias)) | Regular Settings
* Stop Loss Feature Varies Regarding To Main Entry And Can Occur Unevenly
- Position On A 1.5RR
* Stop Loss At 110.00 USD
* Entry At 138.00 USD
* Take Profit At 180.00 USD
* (Uptrend Argument)) & No Pattern Confirmation
- Continuation Pattern | Not Valid
- Reversal Pattern | Not Valid
* Ongoing Entry & (Neutral Area))
Active Sessions On Relevant Range & Elemented Probabilities;
European-Session(Upwards) - East Coast-Session(Downwards) - Asian-Session(Ranging)
Conclusion | Trade Plan Execution & Risk Management On Demand;
Overall Consensus | Buy
ARM/N trade ideas
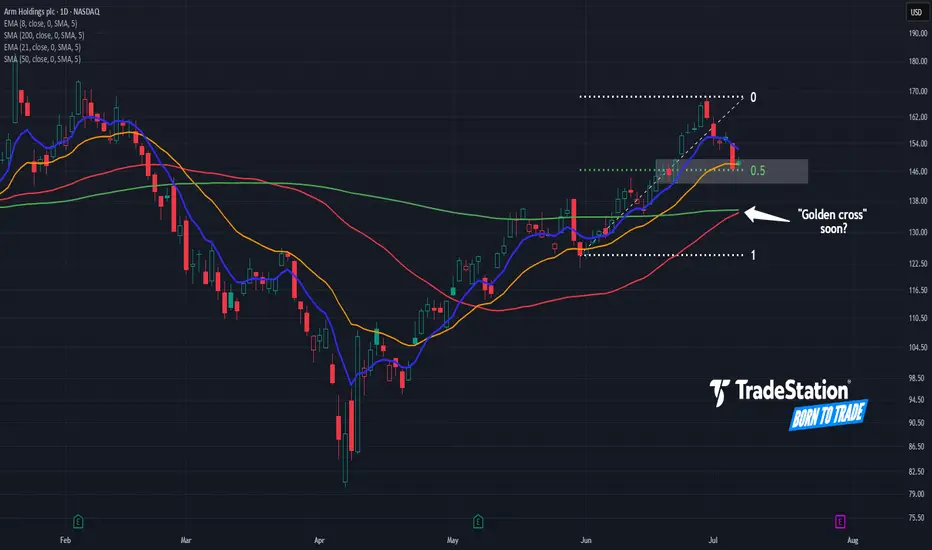
Arm Pulls BackArm Holdings rallied sharply last month, and now the AI chip stock has pulled back.
The first pattern on today’s chart is the advance from May 30 through June 30. ARM retraced half that move and is trying to bounce, which may confirm its upward direction.
Second, prices have retested their rising 21-day exponential moving average (EMA). The 8-day EMA is also above the 21-day EMA. Those signals may be consistent with short-term bullishness.
Third, the 50-day simple moving average (SMA) is nearing a potential “golden cross” above the 200-day SMA. That could reflect longer-term bullishness.
Finally, a four-session consolidation zone formed in late June between roughly $143 and $149. Will it now emerge as new support?
Check out TradingView's The Leap competition sponsored by TradeStation.
TradeStation has, for decades, advanced the trading industry, providing access to stocks, options and futures. If you're born to trade, we could be for you. See our Overview for more.
Past performance, whether actual or indicated by historical tests of strategies, is no guarantee of future performance or success. There is a possibility that you may sustain a loss equal to or greater than your entire investment regardless of which asset class you trade (equities, options or futures); therefore, you should not invest or risk money that you cannot afford to lose. Online trading is not suitable for all investors. View the document titled Characteristics and Risks of Standardized Options at www.TradeStation.com . Before trading any asset class, customers must read the relevant risk disclosure statements on www.TradeStation.com . System access and trade placement and execution may be delayed or fail due to market volatility and volume, quote delays, system and software errors, Internet traffic, outages and other factors.
Securities and futures trading is offered to self-directed customers by TradeStation Securities, Inc., a broker-dealer registered with the Securities and Exchange Commission and a futures commission merchant licensed with the Commodity Futures Trading Commission). TradeStation Securities is a member of the Financial Industry Regulatory Authority, the National Futures Association, and a number of exchanges.
TradeStation Securities, Inc. and TradeStation Technologies, Inc. are each wholly owned subsidiaries of TradeStation Group, Inc., both operating, and providing products and services, under the TradeStation brand and trademark. When applying for, or purchasing, accounts, subscriptions, products and services, it is important that you know which company you will be dealing with. Visit www.TradeStation.com for further important information explaining what this means.
Super Performance Candidate NASDAQ:ARM , A.I market leadership with clients like NASDAQ:META and NASDAQ:GOOG driving demands, strong revenue growth, high margins and bountiful of institutional support, 187 hedge funds to be exact
At a RS Rating of 89,
I have reasons to believe this equity value could increase

ARM looking weakARM is way overvalued and the technicals don't look great.
Not the cleanest head and shoulders pattern but I see one is forming and it should be confirmed, UNLESS we bounce at the golden pocket.
I don't like the bearish diverences on the RSI, so I suspect we will continue to see this fall.
Not a whole lot more to say here, be careful with this stock. It's a great company but it's mostly owned by Softbank and when they decide to sell it will cause a massive drop in price.

6/27/25 - $arm - tf?6/27/25 :: VROCKSTAR :: NASDAQ:ARM
tf?
- narrative follows price, not the other way around
- you don't get away with billion dollar SBC (stock comp) when you hardly will pull down 2 bn in fcf in '26 (on optimistic numbers but for now - let's dream). but let's just assume 2 b is just that. a lick above 1% fcf yield.
- but V, they power the future of the world?
- lol yeah, and nvda does too and already won in their (much larger B2B vertical) and does 3+% fcf yield and grows faster and has better mgns
- so while stupid can persist as long as the casino remains open (you been to a casino lately? that's a real trip to Hades on earth.)
- so if u own this, you might want to make sure you have an edge, because if you are just drawing lines on a chart... and like 90% of other ppl on trading view that do just that i'll be polite and warn you "you don't have an edge".
- i'm a fundamentals guy. so yeah. i'm in btc, gamb and nxt. big cash. and i find hedges here in this environment.
- have a great weekend everyone.
V

6/24/25 - $arm - Short $arm, long $nvda trade6/24/25 :: VROCKSTAR :: NASDAQ:ARM
Short NASDAQ:ARM , long NASDAQ:NVDA trade
- the trade that keeps on giving
- NASDAQ:ARM on it's NASDAQ:NVDA pair (ARM/NVDA) has only been down and do the right, the chart is not something you'd want to step in front of unless you knew of "why" it would fundamentally change
- NASDAQ:ARM trades at a valuation that's 2x NVDA, but the company grows half as fast, has lower margins and generally is size-constrained in a game of scale (TSM will take NVDA all day every day over anyone, incl. ARM demand)
- so while it's tough to time "short semis" - and generally I think semis remain the best MT/LT beta in the market mainly because the AI-trade IMHO remains (dystopianly - i know not a word) in the earlier innings than converse... we've just retraced the entire march/april move from lows back to highs?
- the market has a super short memory
- people are renting their exposure (0dte's). positioning remains stretched. i still like a lot of cash here and good hedges.
- but i'm happy to play the pair between arm and nvda. i'm using $150 strikes (same expiry) for both, equally OTM for both, arm on the put side, nvda on the long side
- my guess is any sell off in beta pulls arm down 2x the nvda beta and any further move higher could suck oxygen out of a tired arm with worse valuation underpinnings and rotating into nvda (a better "store of value") and leading to nvda dominance on the arm chart (again referencing the ARM/NVDA pair trade... lower... forever)
V

Buy Idea – ARM Holdings (ARM)Buy Idea – ARM Holdings (ARM)
• Current price: $131.73
• First target: $135
• Second target: $140
• Stop loss: $128
The stock is trading sideways but is close to a support level at $128. If the price holds above $130 and trading volume picks up, it could move toward the next targets. ARM is a well-known company in chip design used in smartphones and other devices.
Plan: Consider buying gradually at current levels, targeting a medium-term rise.

ARM eyes on $134.08: Semi-Major Genesis fib for High Support? ARM recovering well from last earnings dump.
Now struggling against a Semi-Major Genesis fib.
Look for a higher high or retest of fib for entry.


Arm - Positive outlook ahead of earnings - Value to collect?Hi guys we would be looking into our analysis for ARM Holdings before their earnings call!
ARM Holdings (ARM) – Positive Outlook Ahead of Earnings
ARM Holdings plc, a leading provider of semiconductor intellectual property, is poised to deliver a strong earnings report, driven by robust demand for its advanced chip architectures, continued growth in AI and data center markets, and deepening strategic partnerships across the tech ecosystem. As we approach the upcoming earnings announcement, several key factors support a bullish thesis on ARM's stock.
1. Strong Market Position and Licensing Growth
ARM continues to dominate the RISC-based processor architecture market, with its designs powering over 99% of smartphones and making significant inroads into the computing and server space. The company's royalty and licensing model provides a resilient revenue base, which has historically performed well even during industry slowdowns. Recent licensing agreements with leading tech companies, including NVIDIA, Apple, and Amazon, signal continued reliance on ARM's technology.
In Q1 2025, analysts expect double-digit year-over-year growth in licensing revenue, reflecting heightened demand for ARMv9 architecture, which powers next-generation AI and machine learning workloads. This growth is being further fueled by increased adoption in automotive and IoT sectors.
2. AI and Data Center Tailwinds
The surge in AI demand is transforming the semiconductor landscape. ARM's energy-efficient designs are increasingly being integrated into AI accelerators, edge devices, and cloud data centers. The company's Neoverse platform has been gaining traction, especially as hyperscalers seek alternatives to x86 architectures for power- and cost-efficiency. Amazon Web Services’ Graviton processors, based on ARM, are a prominent example of this trend.
As AI infrastructure spending accelerates globally, ARM stands to benefit significantly. Positive forward guidance around AI-related royalties and design wins would further validate this tailwind in the upcoming earnings report.
3. Financial Strength and Margin Expansion
Analysts anticipate revenue growth of 20-25% YoY in the upcoming report, accompanied by improved gross and operating margins. ARM’s high-margin royalty revenue stream contributes significantly to profitability, and recent cost controls have enhanced operational efficiency.
The IPO in 2023 provided a strong capital base, enabling increased R&D investment while maintaining financial flexibility. Shareholder sentiment has been buoyed by ARM's prudent capital allocation and expanding free cash flow profile.
4. Ecosystem Momentum and Strategic Partnerships
ARM’s ecosystem-first approach—collaborating with chipmakers, software developers, and system integrators—has become a key competitive advantage. The company's recent partnerships in the automotive and industrial sectors highlight growing non-smartphone revenue streams. Additionally, ARM is collaborating closely with AI chip startups and hyperscalers, reinforcing its central role in the evolving semiconductor landscape.
Investors should also watch for updates on ARM’s role in emerging verticals such as AR/VR, smart cities, and secure edge computing, all of which could significantly boost its long-term growth narrative.
5. Technical and Sentiment Indicators
From a technical standpoint, ARM stock has shown resilience, trading above key moving averages and gaining momentum in recent weeks. Options activity suggests bullish sentiment, with increased call buying ahead of earnings. If the company delivers a beat-and-raise quarter, it could catalyze a breakout to new highs.
📌 Trade Plan
📈 Entry: 121
✅ Target: 144 Below the strong resistance
❌ SL: 95 - Above the strong support

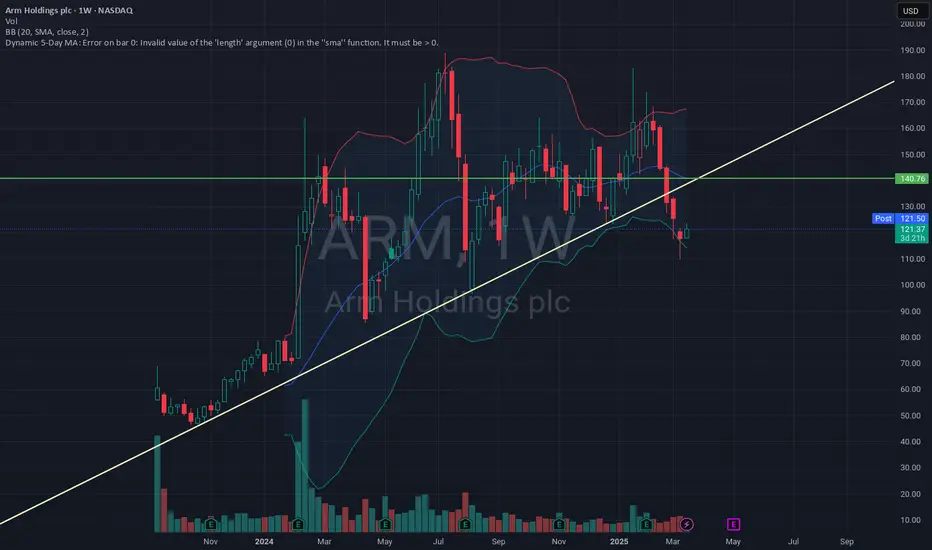
ARM stock: long-term potentialIs the recent decline an opportunity for massive upward potential? 💡
ARM stock holds strong long-term potential, as evident from past price movements. Recent quarterly data suggests the stock has been oversold, creating a possible setup for a rebound. To regain momentum, the stock needs to maintain key support between the 86 and 95 range.

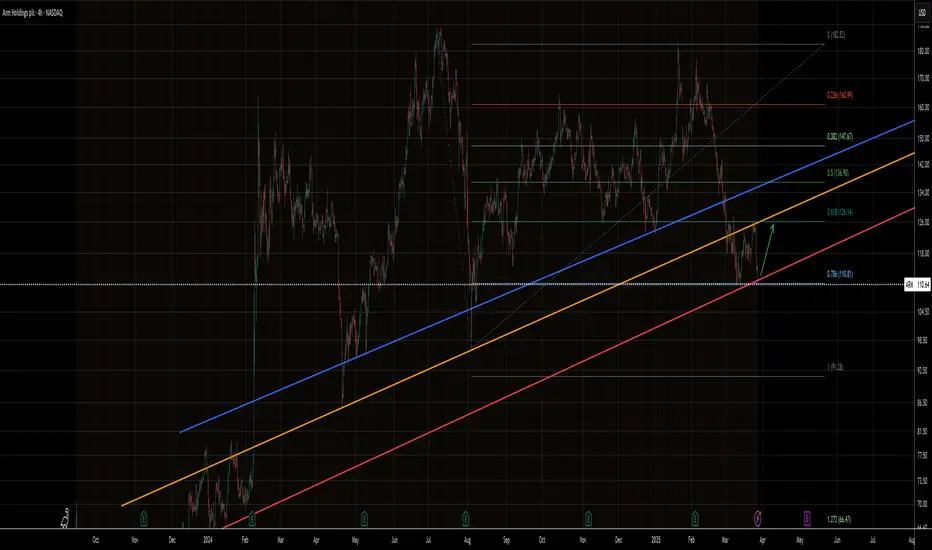
ARM wants to test the 0.6 off the trend line bounceNFA, this is my personal strategy. Looking to the 0.6 for the bounce with a tight SL
130+ Fibonacci resistance zone indicators curving With oscillators curving favorably, Fibonacci confirmed, and MACD turning in favor that triggers other indicators, this is on the high road to potentially 130 and beyond.


Arm Holdings LONGBullish Gartley
ARM Arm Holdings
As always, an idea that needs further multiple confirmations.

ARM Short x 2Entered at 149.15 selling short, felt curious, wanting to learn the mechanics of short selling. Placed trade in ETrade. Buy to cover price $156.36. Using a 2 touch point trendline break. Entered on 30 min TF.

$ARM - Mid $130s Price TargetA major Ascending Triangle is forming, looks like price action may continue trending within the triangle. Price Target near term heading to the mid $130s at the bottom of the ascending triangle.

A support at 155 before breakoutStill moving, so I will have more room to run before it comes down, looking for a start at 162.


ARM - Great AI, Great Financials,formulating Ascending ChannelHi guys we would be looking into ARM Holdings - some fundamentals below
Arm Holdings plc (ARM) has demonstrated impressive financial performance, driven by its strategic positioning in the rapidly expanding artificial intelligence (AI) sector. The company's energy-efficient chip designs have become integral to AI applications, leading to significant revenue growth and increased market valuation.
In the fiscal year ending March 31, 2024, Arm reported a 47% year-over-year increase in revenue, reaching $928 million for the fourth quarter. This surge was primarily due to record-high royalty revenues, with the latest Armv9 technology contributing around 20% of these royalties.
Analysts have recognized Arm's strong market position. Raymond James initiated coverage with an "overweight" rating and a price target of $160, citing Arm's significant role in generative AI and its robust ecosystem.
Similarly, Wells Fargo set a price target of $155, highlighting the transition to Arm's latest technology as a key revenue driver.
Arm's inclusion in the PHLX Semiconductor Sector Index reflects its growing prominence in the semiconductor industry. The company's American depositary receipts have surged approximately 150% since its Nasdaq debut, underscoring investor confidence in its growth trajectory.
Overall, Arm's strategic focus on AI and its innovative chip designs have positioned the company for sustained financial success, making it an attractive consideration for investors seeking exposure to the burgeoning AI market.
Technicals - We have formulated a great Ascending Channel, which is looking to capitalize on great earnings which is due to tomorrow -
Entry: 155
Target: 180 - The Target is just below the strong resistance level which is around 190 mark.

Speculative Madness: The Market’s Bubble Stocks Some stocks areSpeculative Madness: The Market’s Bubble Stocks
Some stocks aren't just overvalued—they're in full speculative bubble mode. Fundamentals? Irrelevant. When euphoria takes over, rationality disappears.
Here’s my list of bubble stocks that scream unsustainable pricing:
SBUX, T, PLTR, BMY, PYPL, NFLX, GS, ISRG, ARM, C, SHOP, BSX, SPOT, UBS, IBKR, RELX, CEG, CRWD, MSTR, MMM, DASH, COF...
And let’s not forget the obvious: TSLA, META, AMZN, AVGO, GOOGL, JPM, MA, V, WMT.
Honestly, the entire banking sector, brokers, and tech are in bubble territory.
What the hell is going on with this market? Why are algos just buying, buying, buying, squeezing all the shorts?! Unbelievable.
The dump will be insannnnnnnne!!! 🚨

Inverted H+S ? Watching this downtrend on the hourly charts, and can see a potential inverted head and shoulders pattern forming, if so it could be enough for a breakout. Tomorrow could be a volatile day with the interest rate decision and with Powell speaking.
