In spaceA space economy company providing communication services through satellite networks.
The space economy is set to explode over the coming years—it’s a good time to start following a few stocks.
The entire space sector is already experiencing strong growth; companies like Rocket Lab have quadrupled in value in just one year!
This stock made a new breakout this week and might be a good opportunity to start accumulating
To those who appreciate my ideas, please give a boost to help improve my reputation and visibility
ASTS trade ideas
$ASTS possible cup and handle NASDAQ:ASTS
Appears a cup and handle is forming, waiting for the handle for confirmation.
LONG-TERM $ASTSYou can't spell Sats without ASTS
This will be a trillion dollar company - here's the next few years, cheers!
ASTS massive daily bull flagWith the cult like following on this ticker, a 4H break out and hold of this bull flag to the upside could see massive retail money piling in to send the price back to $54 ATH. RSI is also showing potential bullish confluence. The 4H chart has daily EMAs overlayed. The price is currently sitting above the daily 7EMA. Breakout above ATH and it's clear blue skies with no resistance. Huge potential.

Quick View : $ASTSThe daily sees a test of the average EMA21 while the hourly tf already shows up a bullish crossover .
Looking for a new high above that level

$ASTS Buying the dip. [Long]
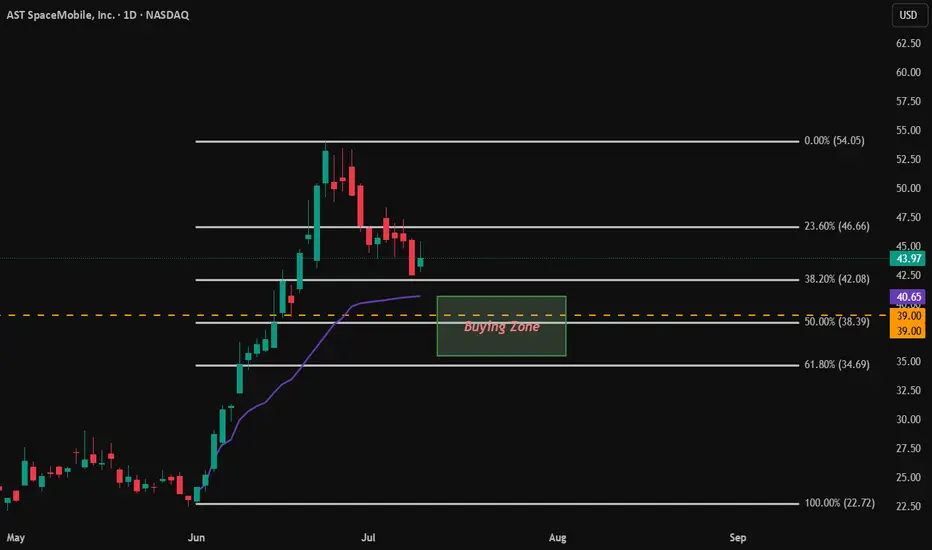
Previous bull runs with 50.0% - 61.8% retracements each time.
Stock is still overvalued.
RSI on weekly and monthly confirm this.
50 SMA is still above 200 SMA, and better retracement will be healthy for a stronger bull run continuation.
Buying Zone: $35.50 - $40.65.
Key Levels and points of interest.
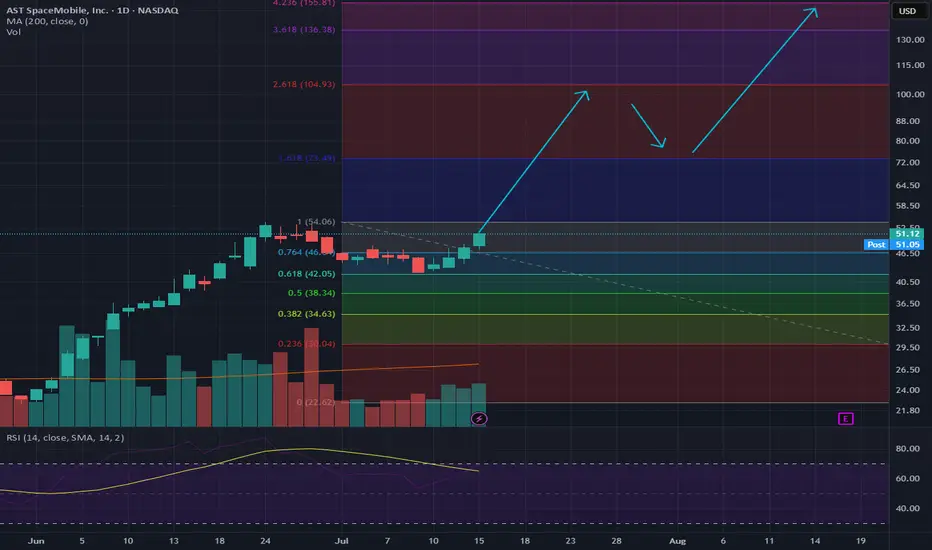
Wave 2 completion at 50%-61.8% retracement. This would place Wave 3 around a target range of $85 or higher.
$55-$57 range is around 45% increase from Wave 2 retracement. This happened during the second run and form a H&S pattern. We want our next run up to pass this $55-57 level.
This isn't intended for financial advice, merely personal analysis.
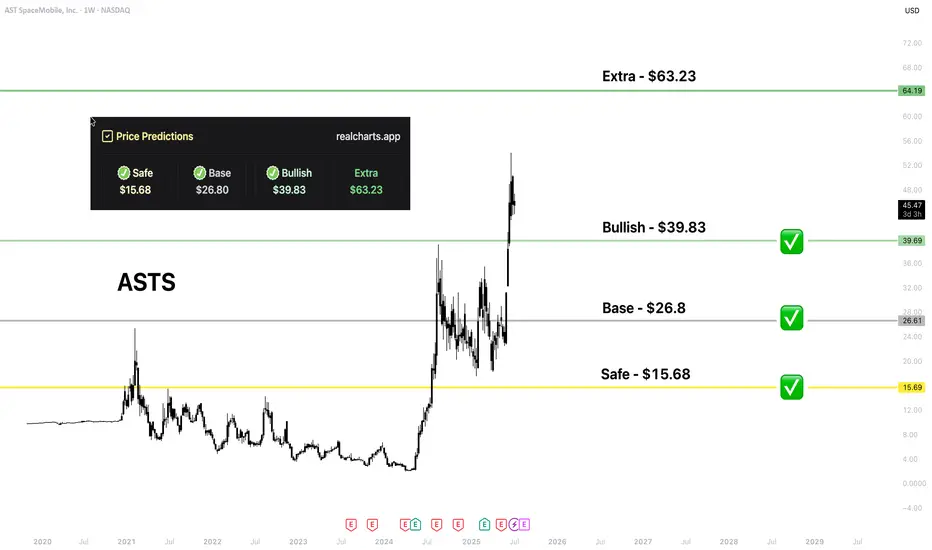
ASTS | Price PredictionNASDAQ:ASTS already hit 3 of 4 targets based on my platform. Massive upside, great asset!
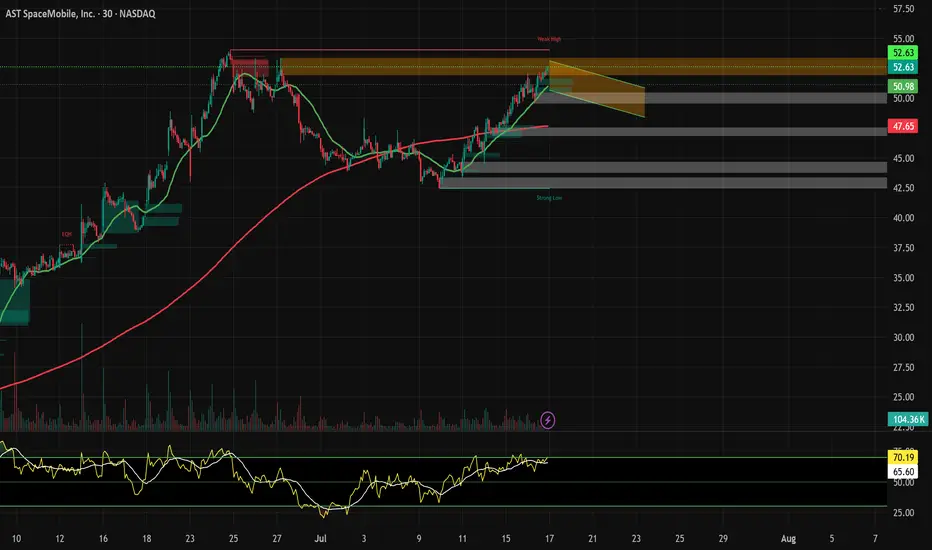
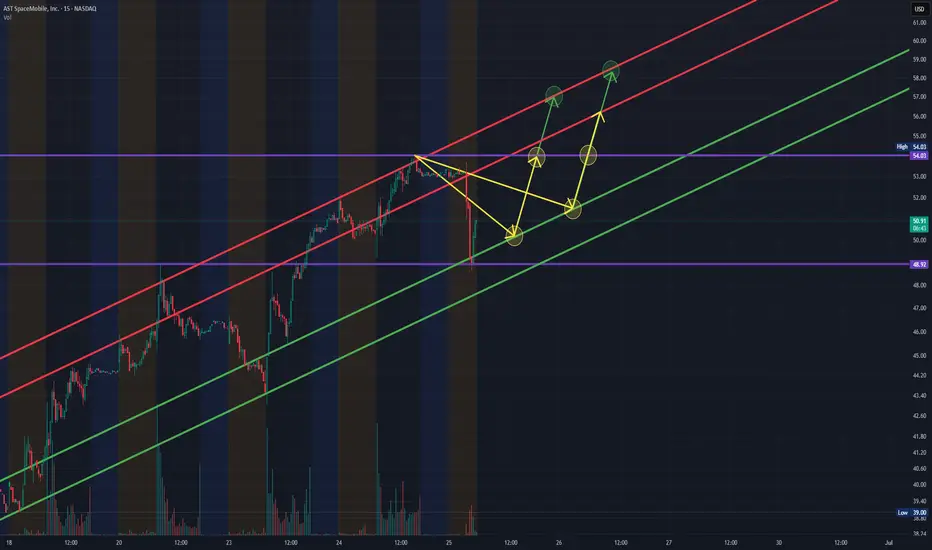
ASTS - Buying Opportunity on ConsolidationASTS set an ATH yesterday (6/25/25) and has consolidated in the pre-market, allowing for anyone who may have missed the stock's run off of those $48.92 Resistance Levels, which have also reversed and turned in support in today's pre-market sessions.
The dip in the stock in this morning's pre-market comes from the company announcing that they will be repurchasing $225M in Debt by selling 9.45M Shares to Participating Note Holders, removing 8.3 Million Underlying Shares in the process.
Looking for another potential re-entry in the stock around the $50.20's-$50.25 price levels with a stop at that previous level of resistance which should act as support if the stock goes any lower first, before heading northward.
$ASTS Short PositionOvervaluation confirmed by RSI indicator.
Massive Doji, signaling pressure and resistance from sellers.
Entry Point: $45.94 (Last daily candle close price)
Stop/Loss: $52.25
Target Profit Price: $35.50
Disclaimer: Charting is strictly for personal analysis, and should not be used for financial advice.

6/24/25 - $asts - Sign of the times... 6/24/25 :: VROCKSTAR :: NASDAQ:ASTS
Sign of the times...
"V, why do you look at so much stuff"
- mainly so i can discern the fear and greed in the market
- while NASDAQ:ASTS is a good product, there's now a lot of "trust me bro" in the >$50 px, even low $20s was a tough punt (and subsequently exited not even in the $30s - just too rich for my criteria)
- but at this pt, while i can't say "it's a short" b/c there's nothing objectively wrong w/ the underlying here per se... the stock is vastly overvalued and a product of the "catch-up" crowd buying 0dte's.
- if you own it today or are considering to own it... careful.
- nobody knows how much the underlying liquidity can run for now... but this thing... is probably not the best use of funds
V

ASTS updateThe price for ASTS has reached $41, hitting a new all-time high for the time being. It may see a near-term pullback to the $35-$36 range. After this potential dip, ASTS could attempt to move upward again, testing the $41 level. This information is for observation only and not a recommendation to buy or sell.

ASTS – 29% Breakout Setup | Ichimoku + R1 Target🚀 Trade Idea: Long AST SpaceMobile ( NASDAQ:ASTS ) with a strong breakout setup forming just above the Ichimoku cloud on the daily chart.
🔍 Technical Breakdown:
Ichimoku Cloud: Price has cleared the cloud, signaling a bullish trend shift. The Tenkan-sen (conversion line) is trending upward, supporting momentum.
Breakout Level: Clean break over horizontal resistance near $25, with a bullish daily close confirming strength.
Volume & Price Action: Bullish candles building above consolidation zone. No upper wicks = buying pressure.
Pivot Points: Next major resistance sits at R1 = $32.99, aligning perfectly with our +29% target.
📊 Trade Details:
Entry: $25.33
Target: $32.99 (+29.35%)
Stop-Loss: $23.75 (-6.23%)
Risk/Reward: 4.71 : 1
💡 Fundamental Angle:
ASTS is building the first space-based cellular broadband network. Any positive news or partnership update could catalyze a sharp move. With shorts potentially caught flat-footed, the setup offers both technical strength and narrative tailwinds.
Watching for:
Sustained volume above $25
Close above $27 to unlock momentum toward $33+
📌 Not Financial Advice. Trade your plan and manage your risk.
#ASTS #Breakout #Ichimoku #SwingTrade #TechnicalAnalysis #SpaceTech #Stocks #TradingView

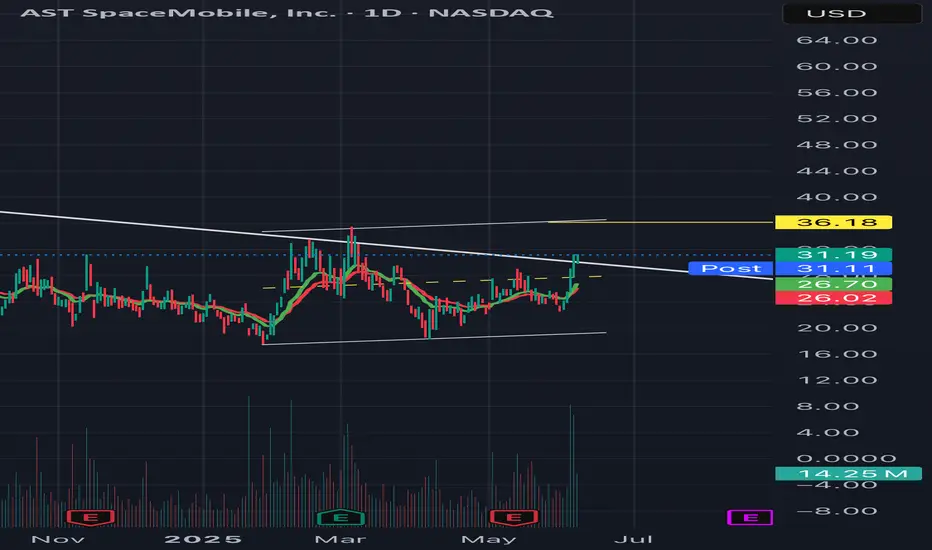
Buying ASTS — Waiting for BreakoutASTS has broken out of a long-term downtrend and is now consolidating in a tight range, forming a base after a strong impulse move. This kind of price action often leads to another breakout, especially when supported by rising volume and EMAs lining up underneath.
I’m buying in this current zone, expecting a breakout from the range and continuation to the upside. I’ll be watching for confirmation through volume spikes and a clean move above resistance. The chart structure looks strong, and the upside potential remains high.
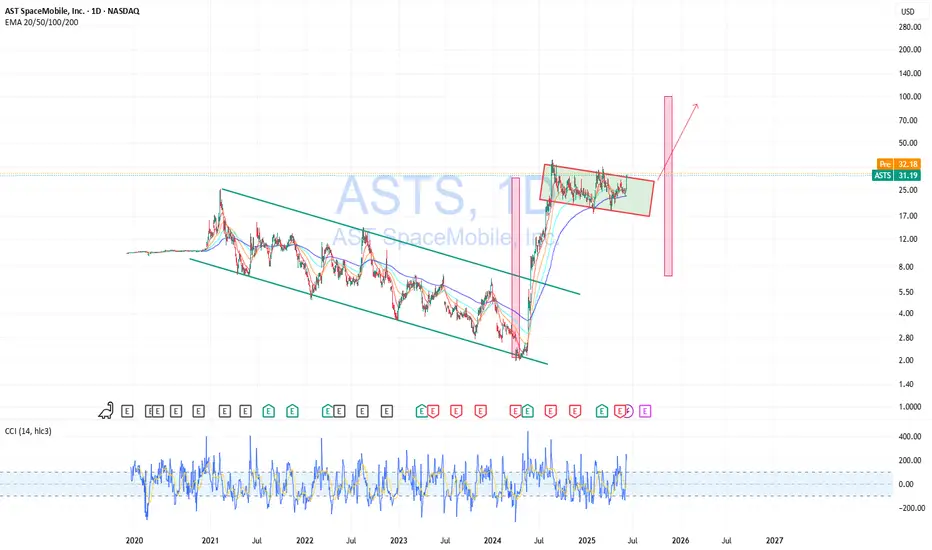
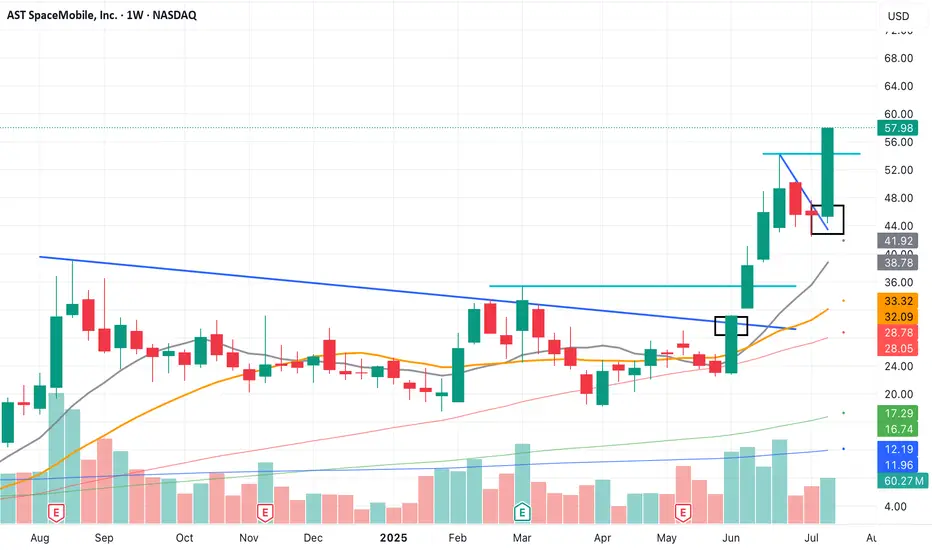
Monster Breakout brewing for ASTS🔍 NASDAQ:ASTS Weekly Chart Analysis (Accurate)
Pattern: Massive bull flag / consolidation wedge after a parabolic run.
Current Price: ~$31.20, sitting near the midpoint of the descending channel.
Structure:
Price is compressing between lower highs and higher lows.
Volume spikes on up moves, low volume on pullbacks = bullish accumulation.
Testing upper trendline of the flag — breakout could trigger a new wave.
✅ Favorable Path:
Break and weekly close above ~$34.00 (channel resistance) confirms breakout. That opens up a measured move targeting $50–55 short-term, and possibly $70+ if momentum accelerates.
🎯 Measured Move Target:
Pole base ~$6 → Flag peak ~$36 = ~$30 range
Breakout above $34 → Target = $34 + 30 = $64
⚠️ Invalidation:
A breakdown below $24–25 zone would invalidate the flag and suggest distribution instead of continuation.
🔑 Summary:
Setup: Weekly bull flag after a parabolic leg
Bias: Strongly bullish with breakout potential
Trigger: Weekly close above $34.00
Short-term target: $50–55
Full measured move target: ~$64
Invalidation zone: Below $24
Smart money appears to be loading the dips. Breakout traders should watch $34 like a hawk.

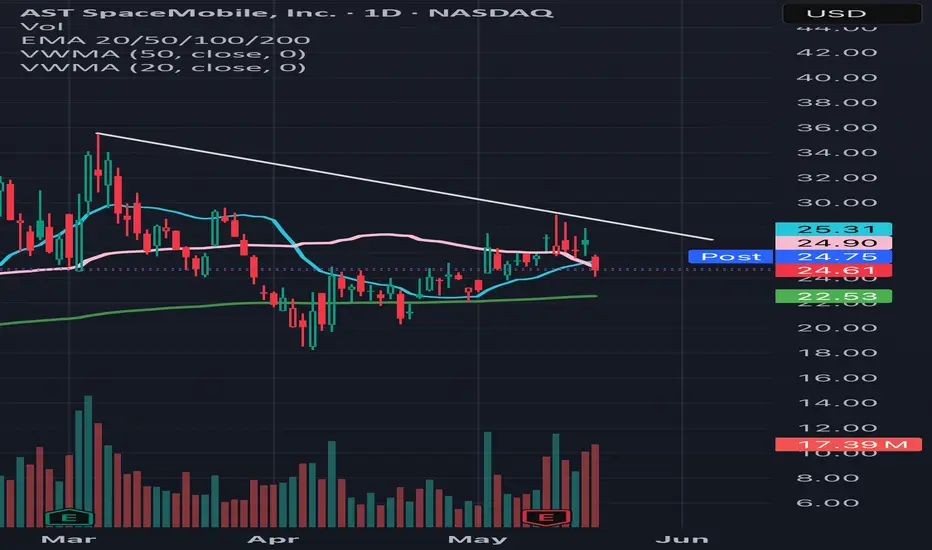
ASTS update lastNot advisable for buying or selling. I predict it will reach 36, as indicated by the downward breakout trend shown in the chart.
Everything here is my own thoughts.
ASTS Chart UpdateFor ASTS: The short-term price target 🎯 has been met. If the stock closes above $28.87, it could signal bullish momentum, potentially pushing the price toward $30-$33, contingent on strong trading volume to sustain the upward move. Keep an eye on market sentiment and volume trends for confirmation.

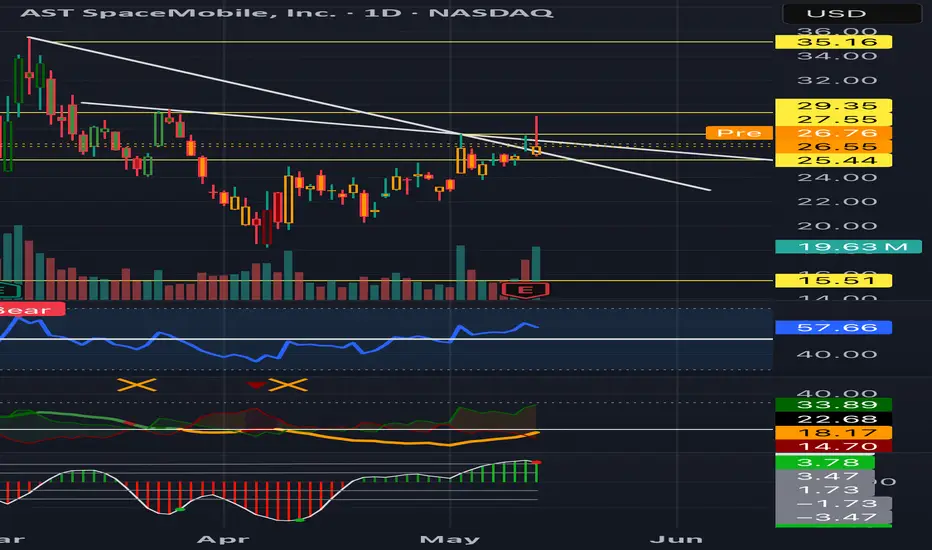
ASTS updateIf the descending triangle downtrend on the ASTS chart has broken as indicated in the circle, and price close above it we could see the stock price accelerate upward.

ASTS breaking outOn the 2-hour time frame, AST SpaceMobile (NASDAQ:ASTS) has broken out of a downtrend, as shown in the chart, but has not yet closed above the critical resistance level of $25.69, with the current price at $25.18. This breakout suggests a potential shift in momentum. If the stock sustains this upward trend and closes above $25.69, technical indicators point to a possible target of around $29. However, failure to break this resistance could limit near-term gains in the dynamic space-telecom sector.

$ASTS Trade Alert Setup - 26% Upside🚨 NASDAQ:ASTS Trade Alert Setup 🚨
Falling Wedge Breakout at $24.37 =
🎯 $29.07 📏 $30.77
Trading Plan: July 11th $26 Calls on Breakout or shares

Heading to 18.50?Breached all supports on Daily and forced a change in trend. MACD shows start of a bear trend and RSI rolling down too.

ASTS update This is not a recommendation to buy or sell.
ASTS may show bullish momentum if it closes above 29.22, potentially breaking its downward trend.
Thank you! 🫶
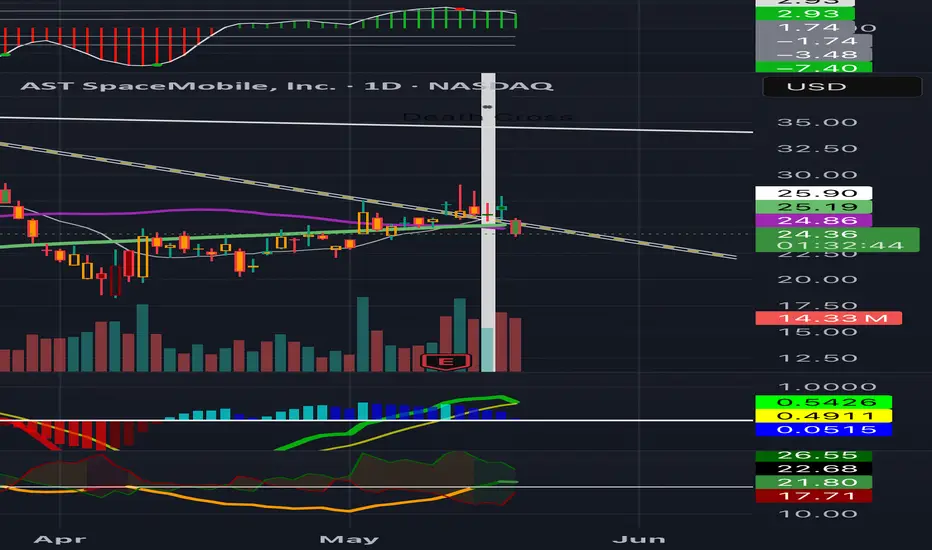
Death cross triggers ASTS exit signal?Hello everyone,
Has ASTS reached an exit point due to the 50-day SMA crossing below the 200-day SMA in a bearish signal, or is it too early to confirm?