BUY of BROADCOM 15 MnHey traders, **DISCLAIMER** content on this analysis is subject to change at any time without notice, and is provided for the sole purpose of assisting traders to make independent investment decisions. BROADCOM is in a very important moment, it is plausible to see a pull back but that will not really change its rise.
Please LIKE & FOLLOW, thank you!
AVGO trade ideas
AVGO Long IdeaTechnological stock NASDAQ:AVGO goes down and this is opportunity for LONG position.
The analysis based on Bollinger Bands (21,2) and RSI (30,70). We can see at 258$ the BB breakout when the RSI indicate to wait for more drop down.
Together with support trend line it's yield a strong buy at 254$.
Two scenarios are possible, the stock still goes down below 254$ , then RSI ALGO (8,65,35) will indicate the time to buy, otherwise the stock will start go up immediately to 278.02$ . This idea should not be considered a buy or sell recommendation.
AVGO Short term analysisAVGO, solid company, great future outlook. Look for a break through resistance at $243.94 before you jump in on this stock. It has been rejected twice so far in the last month at $243.94. Tons of room to grow when it breaks through, next stop is at $263.17 (7.88% increase)
White Lines indicate resistance levels
LONG BULLISH Daily and weekly charts looking pretty bullish. Using modified pitchfork from highs and lows you can predict the reversal candle. Take a look, I started with candle 1,2,3 and you can see centerline crosses candle 4 which is the reversal candle. Continuing with 2,3,4 you'll see the centerline hits reversal candle 6. Now 4,5,6 combined (pitchfork&modified schiff) centerline crosses the price rejection $331.20ish (rejected twice) with the support of recent agreements with Apple, I suspect this will go over $326 this week and will finally break the resistance prior pullbacks.
Broadcom Breakout AlertPossible breakout opportunity in AVGO.
2 Trade options, (1) trade to resistance & (2) trade the actual breakout.
P/e ratio 47
Average Recommendation: Overweight Average Target Price:$355
20 BUY
02 OVERWEIGHT
12 HOLD
00 SELL
Company profile
Broadcom, Inc. is a global technology company, which designs, develops and supplies semiconductor and infrastructure software solutions. It operates through the following segments: Semiconductor Solutions, Infrastructure Software and IP licensing. The Semiconductor Solutions segment manages movement of data in data center, telecom, enterprise and embedded networking applications. The Infrastructure Software segment provides a portfolio of mainframe, enterprise and storage area networking solutions. The IP licensing segment licenses a portion of its broad IP portfolio. The company was founded in 1961 and is headquartered in San Jose, CA.
PLEASE GIVE US A LIKE IF YOU FIND OUR CONTENT HELPFUL, IT IS REALLY APPRECIATED
AVGO - WEEK CHART Hi, today we are going to talk about Broadcom and its current landscape.
Broadcom is poised to receive increasing attention from the market as relevant events are taking place. The company's exposure to the 5G and progress on the sector raises Broadcom's potential valuation, despite the company has unveiled a timid forecast for 2020.
Thank you for reading and leave your comments if you like.
To have access to our exclusive contents, join the Traders Heaven today! Link Below.
Disclaimer: All content of Golden Dragon has only educational and informational purposes, and never should be used or take it as financial advice.
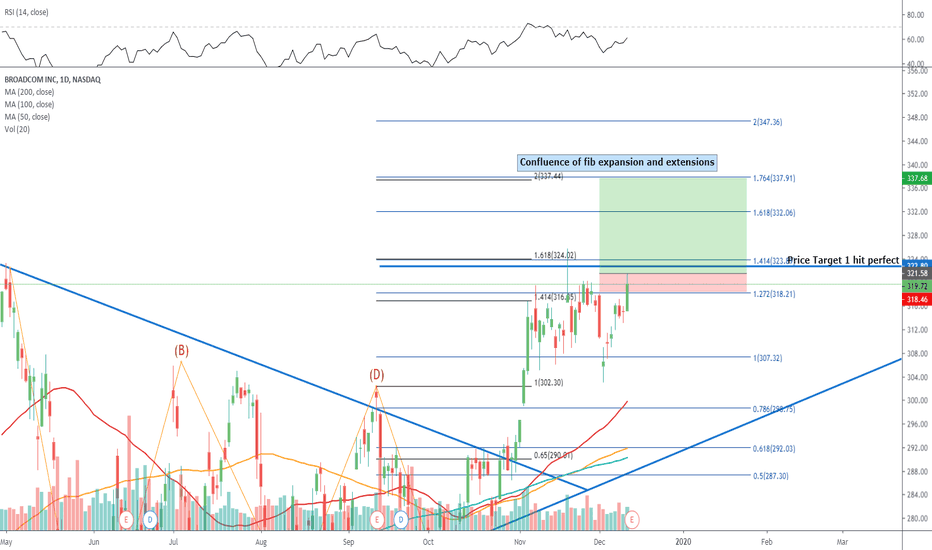
$AVGO Broadcom pre earnings trade setupEntry level $321.58 = Target price $337.68 = Stop loss $318.46
Previous target hit and now ready to break to All time highs
It is expected that a massive buyback will be announced after earnings.
Price action is bullish and sentiment great as the SEMi's signal a turnaround in the world economy.
Broadcom, Inc., is a holding company, which engages in the design, development, and supply of analog and digital semiconductor connectivity solutions. It operates through the following segments: Wired Infrastructure, Wireless Communications, Enterprise Storage, and Industrial and Other. The Wired Infrastructure segment provides semiconductor solutions for enabling the Set-top Box and broadband access markets. The Wireless Communications segment includes mobile handsets and tablets. The Enterprise Storage segment offers storage products the enable secure movement of digital data to and from host machines such as servers, personal computers, and storage systems to the underlying storage devices. The Industrial and Other segment consists of a variety of products for the general industrial and automotive markets. The company was founded in 1961 and is headquartered in San Jose, CA.


