BAX PRICE TARGET 93TECHNICAL ANALYSIS
Daily: price in the entry zone per fibo 50% -61.8%. Price lateralization after falling 6.68% and rebounding in the same area, possible upward movement. We have a GAP between the prices $ 90.47 and $ 88.26, the price should go to close the GAP.
A second entry point at $ 79.16
Diario: precio en zona de entrada por fibo 50%-61.8%. Lateralización del precio despues de la caída de 6.68% y rebotando en la misma zona, posible movimiento a la alza. Tenemos un GAP entre los precios $90.47 y $88.26, el precio deberia ir a cerrar el GAP.
Un segundo punto de entrada en $79.16
FEAR & GREED INDEX : 36 -Fear,,
“sea temerosos cuando otros son codiciosos, y sólo codicioso cuando otros son temerosos” - Warren Buffett
PRICE TARGET: $93-$98 (Barclays/ citigroup)
HEDGE FUND TRACK:
Robert Olstein - Olstein Capital Management /////// # acciones 82,000
Mairs & Power Growth Fund /////// # acciones 225,000
Important note: ⚠️ All trades have risks that the investor must consider before investing. VivirdelTrading.club makes a disclaimer of any operation that may generate losses. All information transmitted by the channel, the page and the alert system is shared in good faith. There is no guarantee of 100% of the executed operations, as these are based on statistical models and assumptions regarding the past behavior of the price of a share, but they do not guarantee the same future behavior.
BAX trade ideas

BAX - flag pattern, volatility contractionNYSE:BAX
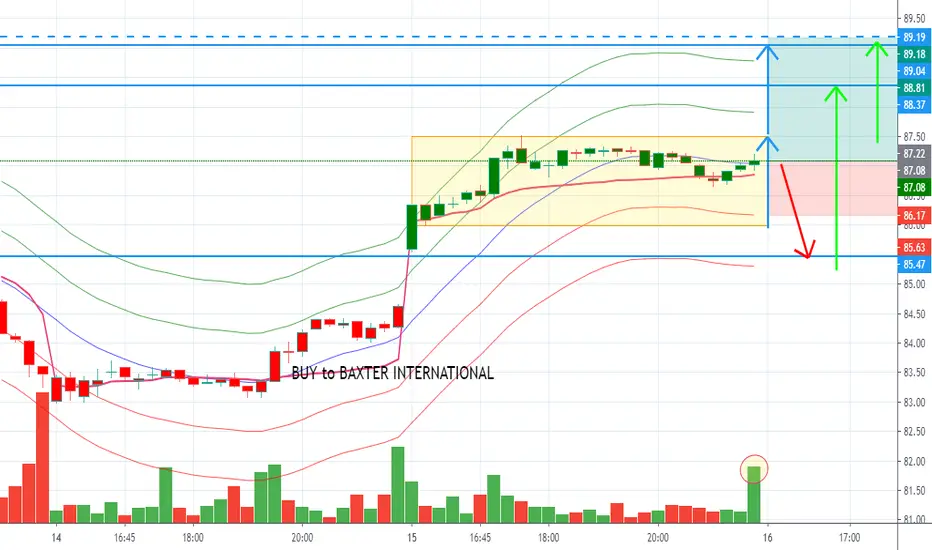
Interesting setup in BAX - it was in a huge long-term downtrend that was broken in the second part of March. It's now digesting recent gains. The volatility is contracting, so it is slowly accumulating power for the next move. My plan is to go long when the price gets above the recent high VWAP with the stop loss below Tuesday's low (13 Apr), when it opened with a gap down, but it was immediately bought. To be precise about the stop loss, I would set it 1,5 ATR (on the 15M timeframe) below that low.

BAX WEEKLY CHARTBAXTER is in an uptrend on the weekly chart. The price is making higher lows and higher highs. In the short term it has broken a bearish channel with a wide-ranging weekly candlestick that indicates ample volume. We are looking for a little more than one to one in our risk/reward ratio.
---------------------------------------------------------
BAXTER está en una tendencia alcista en gráfica semanal. El precio nos está dejando mínimos y máximos crecientes. En el corto plazo a roto un canal bajista con una vela semanal de amplio rango que nos indica amplio volumen. Buscamos poco más del uno a uno en nuestro ratio riesgo/ beneficio

Bottom-fishing for long-term trading.According to Wells Fargo Advisors, "BAX: OMCL Would Be An Excellent Fit ... OMCL would bring better IT integration and an expanded set of hospital relationships as Baxter launches a new infusion pump next year. OMCL might also be able to finally realize its vision of a stronger international business (9% of total revenue) with the help of Baxter’s infrastructure. The pandemic pressured OMCL’s original 13% revenue growth target for 2020 down to a 2% revenue decline. However, management indicated bookings surged so much in Q3 the company was able to reinstate its original 9% bookings growth guidance for 2020 and gave a 2021 revenue outlook of 17% growth (13% organic). So, fundamentals seem solid."

the b[AI]te's weekly insights -- BAX 2021-02-01center stage attention
stock
our system found that BAX received most attention over the course of last week.
comment image
we see a week positive correlation with our image indicator. We therefore assume that prices are driven by facts rather than emotions and reflect an accurate picture of the companies current state of affairs.
new free tool
we launched our new free analysis tool. Check our website and test it out!
new free and powerful data API
you can now access our data via our free API . Check our website and test it out!
FAQ
ATTENTION
our algorithms define ATTENTION as the overall number of stories and opinions that appear for a given security each day.
IMAGE
our algorithms define IMAGE as the averaged sentiment value extracted from all opinions received for a given security per day.

daily analysis of BAXTER INTERNATIONAL INC Hi friends
the daily chart of this market shows that it will experience a downtrend in the coming days but also you have to be vigilant of the change of direction towards the oppser
please subscribe to receive more analysis

BAX long for the short-term Traded inside descending channel. Had reversal on the bottom + confirmation candle.
Target around 81$-82$.
Stop at 79$


BAXTER INTERNATIONAL EstimatesHey guys, BAXTER INTERNATIONAL gives a bearish signal, refusal of sellers with purchase volume. We are heading towards the last lowest in the gap, for a reversal to join the consolidation zone, breakout to arrive in a new zone. We go to the first higher of this one, possibility of breaking it to negotiate the price in this area.
Please LIKE & FOLLOW, thank you!


Baxter International Inc [ NYSE: BAX ]Baxter International Inc
Pending Order Placement
Entry Placement 93.99
Take Profit Placement 105.09
Stop Loss Placement 86.59


BAX - Long setup + BAX at current price, and mention would consider option play. Target: Momentum (Long-term)

BAX - Post-Earnings Gap Down Bottom?BAX gapped down after a poor earnings announcement & has been trying to bottom since. The stock is still oversold but is trying to find some strength. It won't take much to bump into gap resistance but if it can get passed that it can get back to the $87 range.

Third Points Buying PatternIt is an interesting observation to see that Loeb, a man who's lineage derives from a family with 100's of years of banking experience, waited for the deadcat bounce to sell those 8 million shares. It was very good timing. You could also say that his reaction was just the most common sense thing to do at the time considering the market was in freefall, but hindsight is 20/20


BAX - Cup and Handle PatternA Cup and Handle pattern is setting up in BAX. We could see higher prices in future.

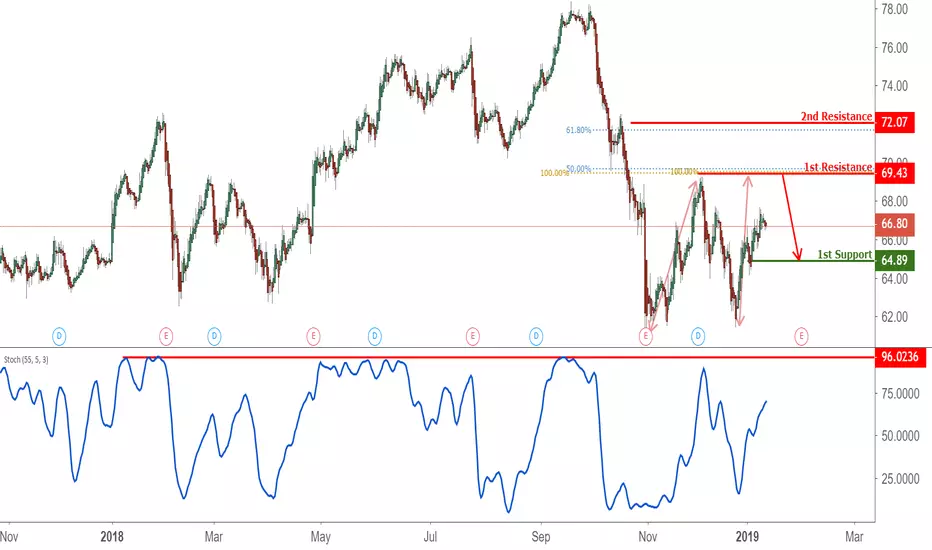
BAX Approaching Support, Potential Bounce!BAX is approaching support where a potential bounce to its resistance could occur.
SupportThe previous high at 78.51shall be a support now from which another attempt upward may begin.

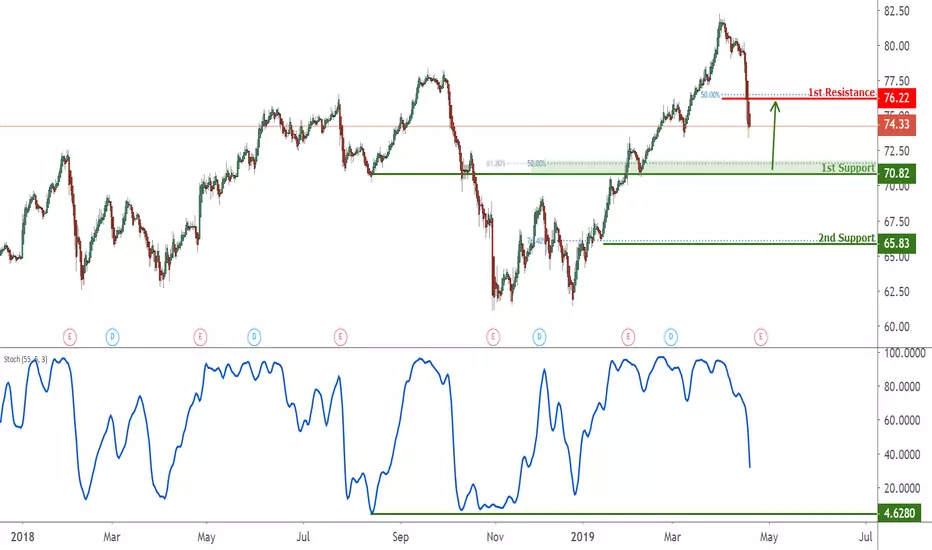
BAX approaching support, potential bounce! BAX is approaching our first support at 70.38 (horizontal overlap support, 23.6% fiboancci retracement, 61.8% fiboancci extension) where a strong bounce might occur above this level pushing price up to our major resistance at 74.33 (76.4% fibonacci retracement).
RSI (89,5,3) is also seeing a bullish exit where we might see a corresponding rise in price.