Search
Products
Community
Markets
News
Brokers
More
EN
Get started
Markets
/
Mexico
/
ETF market
/
C40/N
AMUNDI INDEX SOLUTIONS AMUNDI CAC 40 ESG
C40/N
Mexican Stock Exchange
C40/N
Mexican Stock Exchange
C40/N
Mexican Stock Exchange
C40/N
Mexican Stock Exchange
Market closed
Market closed
No trades
See on Supercharts
Overview
Analysis
Ideas
Discussions
Technicals
Seasonals
C40/N
chart
Price
NAV
More
Full chart
1 day
8.42%
5 days
6.15%
1 month
8.42%
6 months
7.52%
Year to date
0.00%
1 year
38.00%
5 years
63.30%
All time
76.83%
Key stats
Assets under management (AUM)
18.12 B
MXN
Fund flows (1Y)
189.96 M
MXN
Dividend yield (indicated)
—
Discount/Premium to NAV
0.05%
Shares outstanding
131.54 M
Expense ratio
0.25%
About AMUNDI INDEX SOLUTIONS AMUNDI CAC 40 ESG
Issuer
SAS Rue la Boétie
Brand
Amundi
Home page
amundietf.lu
Inception date
Feb 28, 2003
Structure
Luxembourg SICAV
Index tracked
CAC 40 ESG
Replication method
Physical
Management style
Passive
Primary advisor
Amundi Luxembourg SA
ISIN
LU1681046931
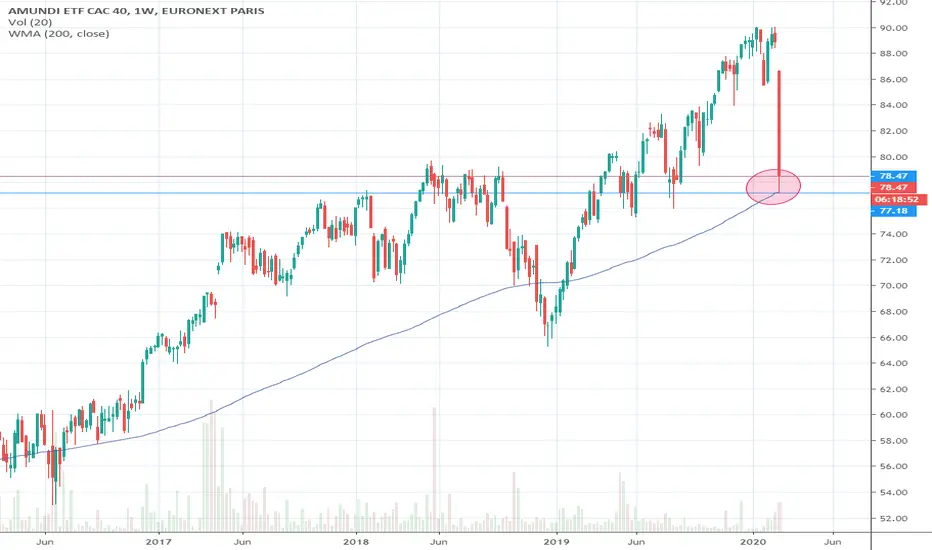
This ETF seeks to replicate as closely as possible the performance of the Cac 40 index whether the trend is rising or falling.
Show more
Classification
Asset Class
Equity
Category
Size and style
Focus
Large cap
Niche
Broad-based
Strategy
ESG
Geography
France
Weighting scheme
Market cap
Selection criteria
Principles-based
C40/N
analysis
What's in the fund
Exposure type
Stocks
Bonds, Cash & Other
Consumer Non-Durables
Electronic Technology
Finance
Producer Manufacturing
Temporary
Stock breakdown by region
100%
Ideas
Buy the DIP?
Resistante / Support zone. MMA200 support.
Long
by javigu
3
See all ideas
Technicals
Summarizing what the indicators are
suggesting.
Oscillators
Neutral
Sell
Buy
Strong sell
Strong buy
Strong sell
Sell
Neutral
Buy
Strong buy
Oscillators
Neutral
Sell
Buy
Strong sell
Strong buy
Strong sell
Sell
Neutral
Buy
Strong buy
Summary
Neutral
Sell
Buy
Strong sell
Strong buy
Strong sell
Sell
Neutral
Buy
Strong buy
Summary
Neutral
Sell
Buy
Strong sell
Strong buy
Strong sell
Sell
Neutral
Buy
Strong buy
Summary
Neutral
Sell
Buy
Strong sell
Strong buy
Strong sell
Sell
Neutral
Buy
Strong buy
Moving Averages
Neutral
Sell
Buy
Strong sell
Strong buy
Strong sell
Sell
Neutral
Buy
Strong buy
Moving Averages
Neutral
Sell
Buy
Strong sell
Strong buy
Strong sell
Sell
Neutral
Buy
Strong buy
Seasonals
Displays a symbol's price movements over previous years to identify recurring trends.