CAT holding support long back to the high for break outCAT holding support long back to the high for break out
CAT trade ideas

CATCup and Handle pattern and trend line support with a resistance area of 140-141. The resistance was tested a few times and rejected but CAT is remaining well pithing the support. Earnings are coming up this week (Fri. Jul 31), however the overall market seems to be staying flat during this big earnings week, and this may suppress a possible ER run-up. Very mixed signals as the 20SMA crossed above the 200SMA, but showing a decline in the ATR, which may indicate a false move. Regardless of earnings, still look for any breaks of the support or resistance for a move up or down.


Caterpillar Long in the next days?Hey everyone,
Seems like a repeating chart pattern to me. But i would say it has to fall a bit more, befor going long. So wait until there are reversal signs!
Much fun with that trade!
Leave a comment :)


$CAT potential weekly #chart breakout $CAT has formed a descending triangle since the high in JAN'18 , but also has been trading inside a descending parallel channel since then
Now after last week ER that was actually rather weak, the stock has found some strength and is trying to breakout from the almost 2 year downtrend
MACD positive and histogram green for the past 2 weeks and rising , RSI around 58 with plenty space upwards (remember is weekly chart we are charting)
Look for either RETEST and/or WEEKLY CLOSE above the descending line in order to participate
Targets:
T1 - measured move from the mirror parallel channel is around 168.94
T2 - measured move from the triangle breakout is around 200.08
Good luck,
TA


Symmetric TriangleCAT appears to be trading in a symmetrical triangle and possible break out was at 120. Earnings are 7-31 BMO
CAT is also riding the bottom rim of a rising wedge pattern. I am hoping for a pull back closer to break out point.
Good luck!

CAT Jul 24 2020 $130 CallI buy call on CAT at strike $130. because patten repeat. Expired July 24, 2020

$CATRed to Green today
Above Chanel and 200 and 50 EMA
It 50 EMA cross 200 EMA will be good
Bought 129.6
target 135 to 138 possible


CATERPILLAR (CAT) Flag Breakout & Bullish Continuation
hey guys,
on a mid-term perspective caterpillar is trading in a bullish trend.
at the beginning of June, the correction started and for the last two weeks the price was steadily going down within a falling channel
but NOW it looks like the market is returning to a trend.
the price broke above a resistance line of a bullish flag formation.
the breakout is considered to be confirmed and we now can expect a further bullish continuation.
target levels:
128.8
131.5

$CHTR $MMM $CAT $DKNG $ROST $LULU - Long provided SPX holds.
If the SPX can hold the trendline. Enter on trigger.
All trades are Long Setup.

CAT - CaterpillarIf the Tentative Trendline will work as trendline, the idea is to go long.
Target price can be the level taht was before the virus.
NYSE:CAT

CAT: Two ascending wedge in a row. Watching
Two ascending wedge in a row with 100% filled targets.
Watching to see what the next move is.

Do The Caterpillar, 🐛 (CAT)🤔 Potential double bottom cup formation, with a higher low on 2nd major structure.
We sit on a very sharp upward support currently, break 128.64 short.
Long the break 140.22
Good luck, 🎲
🥇MLT | MAJOR LEAGUE TRADER


more easy moneycart near resistence line. i think time to re short CAT will be today . be carefull since the market is going parabolic. good luck sorry stop loss type error stop loss above 122

LONG CATKeep your trading simple 🚀🚀🚀
Bullish Long Term
T1 = minimum risk reward 1:1
Long term target $123 - Closing gap.
I always leave 1/3 of my position for long term gains - moving my stop to my entry if I need to give room for the volatility or using trailing stop for maximum gains.
For maximizing your profits you can use Options.
One of the benefits with swing trading is that we collecting dividend along the way.
Not a financial advise just my tradingview - trade smart trade safe.
Follow me to support my work, Thanks!

CAT analysisHello my friends
the analysis of this market shows that there is a very high probability that in the next few days will experience a bearish trend for more information please contact me on
youssef.lyazidi5@gmail.com

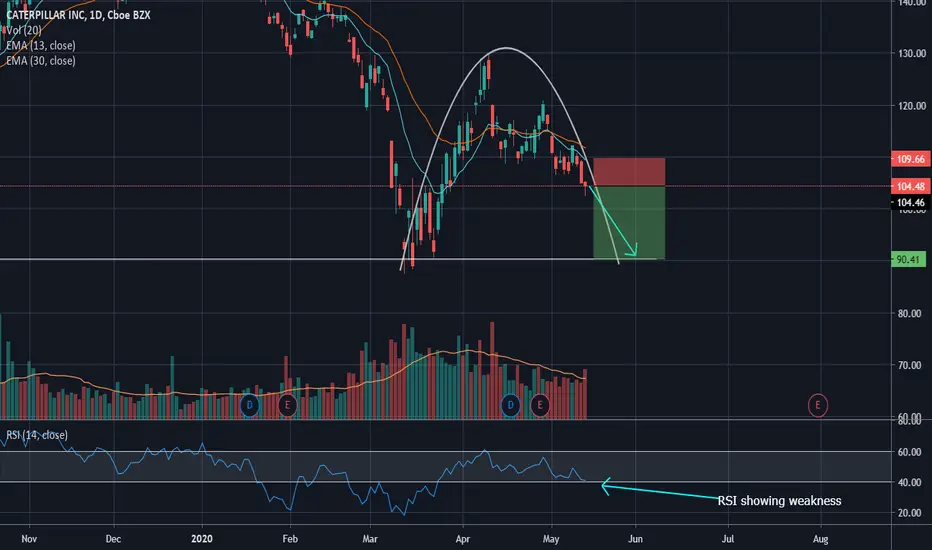
CAT Round downCAT is in a downward trend, showing weakness in the RSI. Any thing below 40 rsi is bearish. Not to much support on this until the $90 area. Its forming a rounding pattern and may take a little over a week to hit potential target.